On this page Skip this page navigation
- Ontario’s Economic and Fiscal Outlook in Brief
- Ontario’s Economic Outlook
- Managing Ontario’s Finances Responsibly
- Ontario’s Medium-Term Fiscal Plan
- Ontario’s Recovery Plan
- Details of Ontario’s Recovery Plan
- Alternative Economic Scenarios and Fiscal Outlooks
- Borrowing and Debt Management
- Ontario’s Capital Plan
Ontario’s Economic and Fiscal Outlook in Brief
Ontario has an ambitious plan for growth, prosperity and jobs. It is a Plan to Build. As part of this plan, the government is making historic investments in health care, education and critical infrastructure, while keeping costs down for seniors, workers and families.
Thanks in part to the government’s unprecedented measures to protect jobs and the economy, Ontario has made significant progress recovering from the COVID-19 pandemic. Ontario’s real gross domestic product (GDP) increased 4.3 per cent in 2021, and employment rose by 344,800 net jobs in 2021 or 4.9 per cent, the strongest annual pace of job growth on record.
Under the government’s planning projection, Ontario is projected to return to a surplus position by 2027–28, two years earlier than forecast in the 2021 Budget. Over the medium term, the government is projecting steadily declining deficits of $19.9 billion in 2022–23, $12.3 billion in 2023–24, and $7.6 billion in 2024–25, representing a significant improvement since the 2021 Budget. Uncertainty still remains about the future pace of economic growth, which may impact these projections further.
The province’s recovery will be driven by economic growth to help bring jobs and prosperity to every corner of the province. While the government can create the conditions for growth, the future prosperity of the province will be made in Ontario by workers, entrepreneurs and families.
Ontario’s Economic Outlook
Ontario’s real GDP is projected to increase by 3.7 per cent in 2022 and 3.1 per cent in 2023. Growth is expected to moderate to 2.0 per cent in 2024 and 1.9 per cent in 2025. For the purposes of prudent fiscal planning, these projections are slightly below the average of private-sector forecasts.
| 2020 | 2021 | 2022p | 2023p | 2024p | 2025p | |
|---|---|---|---|---|---|---|
| Real GDP Growth | (5.1) | 4.3 | 3.7 | 3.1 | 2.0 | 1.9 |
| Nominal GDP Growth | (2.8) | 12.0 | 6.7 | 5.1 | 4.2 | 4.1 |
| Employment Growth | (4.8) | 4.9 | 3.9 | 2.0 | 1.7 | 1.2 |
| CPI Inflation | 0.7 | 3.5 | 4.7 | 2.5 | 2.1 | 2.1 |
Table footnotes:
p = Ontario Ministry of Finance planning projection based on external sources.
Sources: Statistics Canada and Ontario Ministry of Finance.
Managing Ontario’s Finances Responsibly
The government is providing the people of Ontario with a transparent look into the province’s finances and its plan to invest in prosperity, growth and jobs.
The government’s multi-year fiscal plan is consistent with the requirements of the Fiscal Sustainability, Transparency and Accountability Act, 2019 and its governing principles guide Ontario’s fiscal policy.
Maintaining Fiscal Sustainability
Ontario is one of just three provinces whose current fiscal policy is estimated to be sustainable over the long term.
Parliamentary Budget Officer
Fiscal Sustainability Report 20211
- Transparent: The government continues to demonstrate its commitment to transparency through the release of its sixteenth quarterly financial update. In addition, for the fourth year in a row, the Auditor General of Ontario has provided a clean audit opinion on Ontario’s consolidated financial statements.
- Responsible: The government has developed a measured and responsible approach to managing Ontario’s finances that is driven by economic growth, while investing in key public services and capital projects that will help to improve economic productivity and create jobs.
- Flexible: The government’s plan has built in appropriate levels of prudence in the form of contingency funds and a reserve to ensure that the necessary fiscal flexibility is available to respond to changing circumstances.
- Equitable: The government’s plan strengthens critical public services, such as health care, for people today and to ensure that they are available for future generations.
- Sustainable: The government is committed to employing a flexible approach to respond to ongoing economic uncertainty, while balancing these needs with the long-term sustainability of Ontario’s finances, including the province’s debt burden.
Ontario’s Medium-Term Fiscal Plan
In 2022–23, the government is projecting a deficit of $19.9 billion, declining to $12.3 billion in 2023–24 and $7.6 billion in 2024–25. This is a significant improvement compared to the forecasts presented in the 2021 Budget.
| Actual 2020–21 |
Interim1 2021–22 |
Medium-Term Outlook 2022–23 |
Medium-Term Outlook 2023–24 |
Medium-Term Outlook 2024–25 |
|
|---|---|---|---|---|---|
| Revenue — Personal Income Tax | 40.3 | 42.3 | 44.6 | 47.0 | 49.6 |
| Revenue — Sales Tax | 26.6 | 30.4 | 32.3 | 34.2 | 35.7 |
| Revenue — Corporations Tax | 17.8 | 22.2 | 19.7 | 20.4 | 21.1 |
| Revenue — Ontario Health Premium | 4.3 | 4.5 | 4.7 | 4.9 | 5.1 |
| Revenue — Education Property Tax | 6.0 | 5.7 | 5.7 | 5.6 | 5.6 |
| Revenue — All Other Taxes | 15.8 | 19.1 | 19.4 | 21.0 | 21.9 |
| Total Taxation Revenue | 110.9 | 124.2 | 126.4 | 133.2 | 139.1 |
| Government of Canada | 33.9 | 29.7 | 31.0 | 31.8 | 33.4 |
| Income from Government Business Enterprises | 5.0 | 5.6 | 6.3 | 6.7 | 7.5 |
| Other Non-Tax Revenue | 15.1 | 14.1 | 16.1 | 16.5 | 16.9 |
| Total Revenue | 164.9 | 173.6 | 179.8 | 188.2 | 196.9 |
| Base Programs2 — Health Sector | 64.4 | 71.0 | 75.2 | 77.6 | 78.3 |
| Base Programs3 — Education Sector4 | 28.4 | 29.5 | 32.4 | 34.2 | 35.1 |
| Base Programs5 — Postsecondary Education Sector | 9.5 | 10.0 | 10.8 | 11.1 | 11.4 |
| Base Programs6 — Children’s and Social Services Sector | 17.0 | 17.2 | 18.3 | 18.4 | 18.6 |
| Base Programs7 — Justice Sector | 4.6 | 4.8 | 5.3 | 5.2 | 5.1 |
| Base Programs8 — Other Programs | 26.0 | 29.6 | 36.3 | 38.3 | 39.7 |
| Total Base Programs | 150.0 | 162.1 | 178.3 | 184.8 | 188.1 |
| COVID-19 Time-Limited Funding | 19.1 | 12.0 | 6.9 | – | – |
| Total Programs | 169.0 | 174.1 | 185.2 | 184.8 | 188.1 |
| Interest on Debt | 12.3 | 13.0 | 13.5 | 14.3 | 14.9 |
| Total Expense | 181.3 | 187.1 | 198.6 | 199.1 | 203.0 |
| Surplus/(Deficit) Before Reserve | (16.4) | (13.5) | (18.9) | (10.8) | (6.1) |
| Reserve | – | – | 1.0 | 1.5 | 1.5 |
| Surplus/(Deficit) | (16.4) | (13.5) | (19.9) | (12.3) | (7.6) |
| Net Debt as a Per Cent of GDP | 43.1% | 40.7% | 41.4% | 41.4% | 41.3% |
| Net Debt as a Per Cent of Revenue | 226.5% | 227.5% | 238.4% | 239.3% | 238.1% |
| Interest on Debt as a Per Cent of Revenue | 7.4% | 7.5% | 7.5% | 7.6% | 7.5% |
Table footnotes:
[1] Interim represents the 2022 Budget projection for the 2021–22 fiscal year.
[2], [3], [5], [6], [7], [8] For presentation purposes in the 2022 Budget, one-time COVID-19-related spending has been included within COVID-19 Time-Limited Funding. This funding continues to be presented separately in order to transparently capture the temporary nature of these investments.
[4] Excludes Teachers’ Pension Plan. Teachers’ Pension Plan expense is included in Other Programs.
Note: Numbers may not add due to rounding.
Sources: Ontario Treasury Board Secretariat and Ontario Ministry of Finance.
Revenue Outlook over the Medium Term
As a result of Ontario’s strong economic performance and the government’s efforts to protect the economy and jobs, Ontario’s revenue outlook is forecast to increase from $173.6 billion in 2021–22 to $196.9 billion in 2024–25.
Ontario’s revenue outlook is anchored by an economic projection based on private-sector forecasts and the best available information at the time of finalizing the planning projection. Details of the medium-term revenue outlook are outlined later in this Budget. See Chapter 3: Ontario’s Fiscal Plan and Outlook for more details.
Key inputs included in the revenue forecast are a prudent economic outlook; existing federal–provincial agreements and funding formulas; and the business plans of government ministries, business enterprises and service organizations.
Program Expense Outlook over the Medium Term
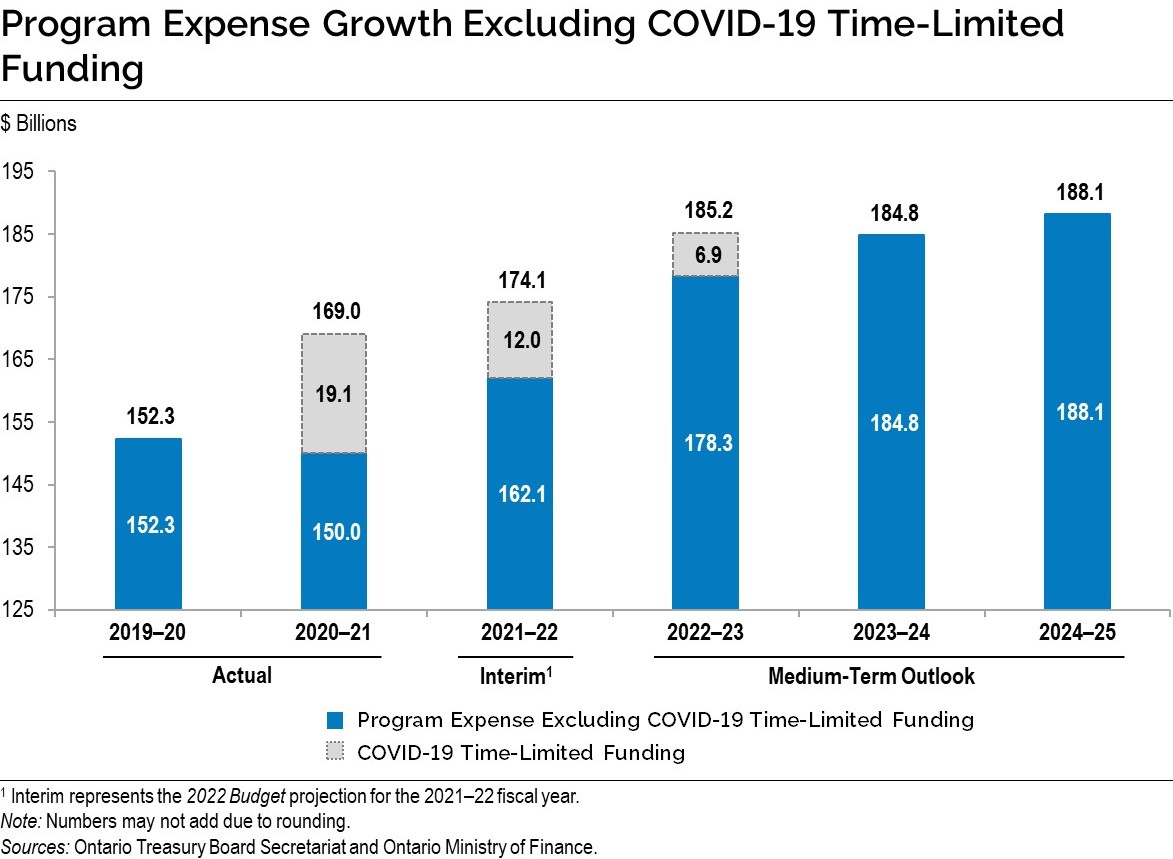
Ontario’s program expense outlook is expected to grow from $174.1 billion in 2021–22 to $188.1 billion in 2024–25. The additional funding will primarily be used to support services including health care, education and other critical investments. Over this period, the government is also making substantial time-limited COVID-19 investments of $18.9 billion, many of which will strengthen Ontario’s resiliency and support the government’s Plan to Stay Open.
In addition to these temporary COVID-19-related initiatives, the government continues to invest in programs that serve the people of Ontario. Over the medium-term outlook, base program expense is projected to increase every year, from $162.1 billion in 2021–22 to $188.1 billion in 2024–25, representing an average annual growth rate of 5.1 per cent from 2021–22 to 2024–25.
Interest on Debt Outlook over the Medium Term
Interest on debt is forecast to be $13.0 billion in 2021–22, down from the 2021 Budget forecast of $13.1 billion, and remains lower than the interest on debt forecast for each year of the medium‑term outlook contained in the 2021 Budget.
Other Fiscal Plan Assumptions over the Medium Term
The reserve is set at $1.0 billion in 2022–23 and $1.5 billion in each year over the medium term.
The net debt-to-GDP ratio for 2022–23 and 2023–24 is projected to be 41.4 per cent and declining to 41.3 per cent in 2024–25.
Ontario’s Recovery Plan
The province is projected to return to a surplus position by 2027–28, two years earlier than forecast in the 2021 Budget.
Recovery Plan Assumptions
Revenue
- Total revenue growth of 3.9 per cent per year over the recovery plan period is based on the projected long-term average annual nominal GDP growth rate of 3.9 per cent, as presented in Ontario’s Long-Term Report on the Economy 2020.
- Taxation revenue growth is based on average annual nominal GDP growth and does not assume any future tax increases.
- Government of Canada transfers reflect existing federal–provincial funding formulas and agreements up to 2024–25 and are mainly composed of the Canada Health Transfer and the Canada Social Transfer. This does not build in additional revenues from any significant new increases in federal transfers such as the Canada Health Transfer, or other potential future changes.
- Net income from government business enterprises is based on current business plans and average annual nominal GDP growth into the future.
- Other non-tax revenues are consistent with population growth and inflation.
Program Expense
- From 2020–21 to 2027–28, total program expense is projected to grow at an average annual rate of 2.5 per cent.
- Over the last 30 years, program expense growth following periods of economic downturn has varied significantly. For example, from 2008–09 to 2017–18, following the 2008 global financial crisis, program expense grew at an average annual rate of 4.3 per cent. Alternatively, following the recession in the early 1990s, program expense grew at an average annual rate of just 0.5 per cent between 1995–96 and 1999–2000.
- Ontario’s long-term overall program expense growth during the recovery plan period is premised on continuing to improve government operations to deliver services more effectively and efficiently, instead of significant cuts to government services.
Reserve
- The reserve is set at $1.5 billion in each year over the recovery plan.
Details of Ontario’s Recovery Plan
| Recovery Plan 2025–26 |
Recovery Plan 2026–27 |
Recovery Plan 2027–28 |
|
|---|---|---|---|
| Revenue — Personal Income Tax | 52.3 | 55.0 | 57.9 |
| Revenue — Sales Tax | 37.2 | 38.8 | 40.4 |
| Revenue — Corporations Tax | 21.8 | 22.5 | 23.2 |
| Revenue — Ontario Health Premium | 5.3 | 5.5 | 5.7 |
| Revenue — Education Property Tax | 5.7 | 5.7 | 5.8 |
| Revenue — All Other Taxes | 22.8 | 23.7 | 24.6 |
| Total Taxation Revenue | 145.0 | 151.2 | 157.6 |
| Government of Canada | 34.5 | 35.6 | 36.7 |
| Income from Government Business Enterprises | 7.8 | 8.1 | 8.4 |
| Other Non-Tax Revenue | 17.3 | 17.8 | 18.3 |
| Total Revenue | 204.6 | 212.6 | 220.9 |
| Programs — Health Sector | 81.4 | 84.6 | 87.8 |
| Programs — Education Sector1 | 35.8 | 36.5 | 37.2 |
| Programs — Postsecondary Education Sector | 11.6 | 11.8 | 12.0 |
| Programs — Children’s and Social Services Sector | 18.9 | 19.2 | 19.4 |
| Programs — Justice Sector | 5.1 | 5.2 | 5.3 |
| Programs — Other Programs | 39.7 | 39.7 | 39.7 |
| Total Programs | 192.5 | 196.9 | 201.4 |
| Interest on Debt | 15.7 | 16.3 | 16.6 |
| Total Expense | 208.1 | 213.2 | 218.0 |
| Surplus/(Deficit) Before Reserve | (3.5) | (0.7) | 2.8 |
| Reserve | 1.5 | 1.5 | 1.5 |
| Surplus/(Deficit) | (5.0) | (2.2) | 1.3 |
| Net Debt as a Per Cent of GDP | 41.0% | 40.3% | 39.1% |
| Net Debt as a Per Cent of Revenue | 236.4% | 232.1% | 225.0% |
| Interest on Debt as a Per Cent of Revenue | 7.7% | 7.7% | 7.5% |
Table footnotes:
[1] Excludes Teachers’ Pension Plan. Teachers’ Pension Plan expense is included in Other Programs.
Note: Numbers may not add due to rounding.
Sources: Ontario Treasury Board Secretariat and Ontario Ministry of Finance.
Alternative Economic Scenarios and Fiscal Outlooks
In recognition of the elevated degree of economic uncertainty, the Ontario Ministry of Finance has developed Faster Growth and Slower Growth scenarios that the economy could take over the next several years. These alternative scenarios should not be considered the best case or the worst case. Rather, they illustrate possible alternative outcomes.
| 2022p | 2023p | 2024p | 2025p | |
|---|---|---|---|---|
| Faster Growth Scenario | 5.2 | 3.8 | 2.3 | 2.2 |
| Planning Projection | 3.7 | 3.1 | 2.0 | 1.9 |
| Slower Growth Scenario | 3.0 | 2.6 | 1.9 | 1.8 |
Table footnotes:
p = Ontario Ministry of Finance planning projection and alternative scenarios.
Source: Ontario Ministry of Finance.
| 2022p | 2023p | 2024p | 2025p | |
|---|---|---|---|---|
| Faster Growth Scenario | 9.8 | 5.9 | 4.7 | 4.6 |
| Planning Projection | 6.7 | 5.1 | 4.2 | 4.1 |
| Slower Growth Scenario | 4.8 | 4.5 | 3.9 | 3.8 |
Table footnotes:
p = Ontario Ministry of Finance planning projection and alternative scenarios.
Source: Ontario Ministry of Finance.
In the event that the alternative economic scenarios materialize as opposed to the Planning Projection, Ontario’s fiscal plan would also change as a result. See Chapter 3: Ontario’s Fiscal Plan and Outlook, Revenue Outlook Scenarios section for more information.
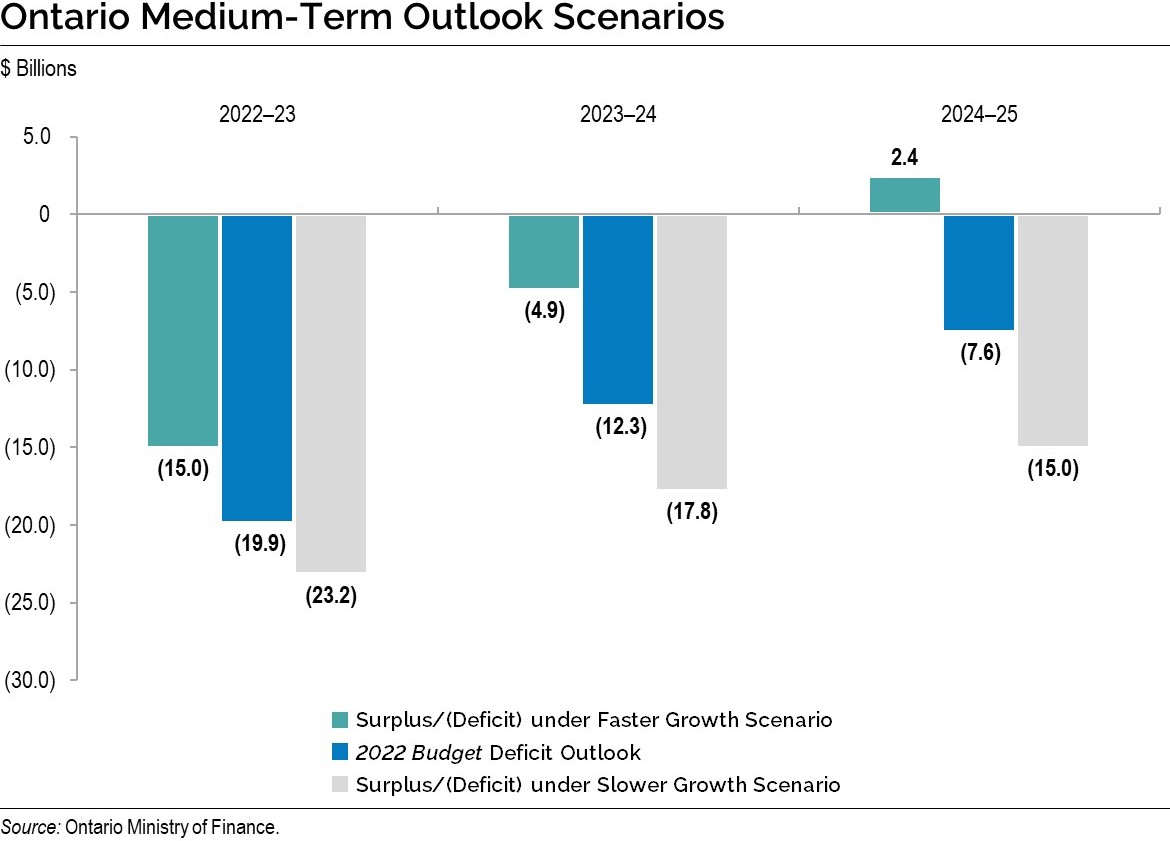
Under the Faster Growth scenario, the deficit outlook may improve to $15.0 billion in 2022–23 and $4.9 billion in 2023–24, and a surplus of $2.4 billion in 2024–25. However, if the Slower Growth scenario takes place instead, the deficit outlook may deteriorate to $23.2 billion in 2022–23, $17.8 billion in 2023–24, and $15.0 billion in 2024–25.
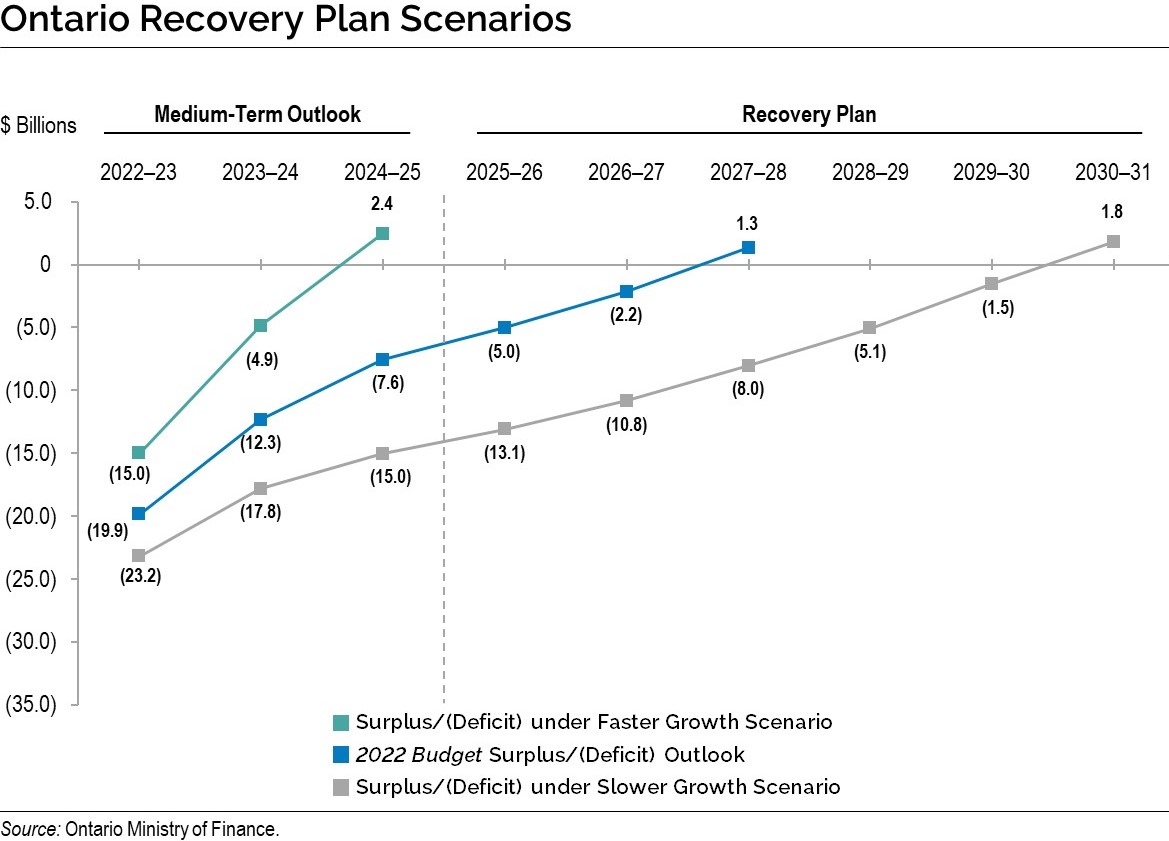
In addition to alternative outlook scenarios over the medium term, the government has developed two alternative recovery plans. As shown in the graph below, the starting point for each of these scenarios varies based on how quickly the Ontario economy will grow between 2022 and 2025. Under the Faster Growth scenario, the government could eliminate the deficit by 2024–25. However, under the Slower Growth scenario, the recovery plan could be prolonged with the deficit projected to be eliminated in 2030–31.
Borrowing and Debt Management
Ontario’s borrowing program is primarily used to fund deficits, refinance maturing debt and make investments in capital assets. Ontario will continue to finance most of its borrowing program in the long-term public markets in Canada as well as internationally. Ontario has completed its long-term public borrowing for 2021–22 of $41.1 billion, including $10.3 billion in pre-borrowing for 2022–23. The total long-term borrowing requirements for 2022–23, 2023–24 and 2024–25 are forecast to be $41.5 billion, $44.6 billion and $38.9 billion, respectively.
| 2021 Budget | Change from 2021 Budget | Interim1 2021–22 |
Medium-Term Outlook 2022–23 |
Medium-Term Outlook 2023–24 |
Medium-Term Outlook 2024–25 |
|
|---|---|---|---|---|---|---|
| Deficit/(Surplus) | 33.1 | (19.6) | 13.5 | 19.9 | 12.3 | 7.6 |
| Investment in Capital Assets | 11.8 | 1.0 | 12.9 | 13.4 | 13.6 | 14.8 |
| Non-Cash Adjustments | (9.5) | 1.1 | (8.4) | (9.7) | (9.6) | (10.5) |
| Loans to Infrastructure Ontario | 0.2 | 0.0 | 0.3 | (0.1) | 0.2 | 0.0 |
| Other Net Loans/Investments | 1.3 | (1.4) | (0.1) | 0.7 | (0.1) | (0.9) |
| Debt Maturities/Redemptions | 25.0 | 0.0 | 25.0 | 30.5 | 31.2 | 27.8 |
| Total Funding Requirement | 61.9 | (18.9) | 43.1 | 54.7 | 47.6 | 38.9 |
| Decrease/(Increase) in Short-Term Borrowing | (6.0) | 6.0 | – | (3.0) | (3.0) | – |
| Increase/(Decrease) in Cash and Cash Equivalents | 4.0 | – | 4.0 | – | – | – |
| Pre-borrowing in 2020–21 for 2021–22 | (5.2) | (10.9) | (16.2) | – | – | – |
| Pre-borrowing for 2022–23 | – | 10.3 | 10.3 | (10.3) | – | – |
| Total Long-Term Public Borrowing | 54.7 | (13.5) | 41.1 | 41.5 | 44.6 | 38.9 |
Table footnotes:
[1] Interim represents the 2022 Budget projection for the 2021–22 fiscal year.
Note: Numbers may not add due to rounding.
Source: Ontario Financing Authority.
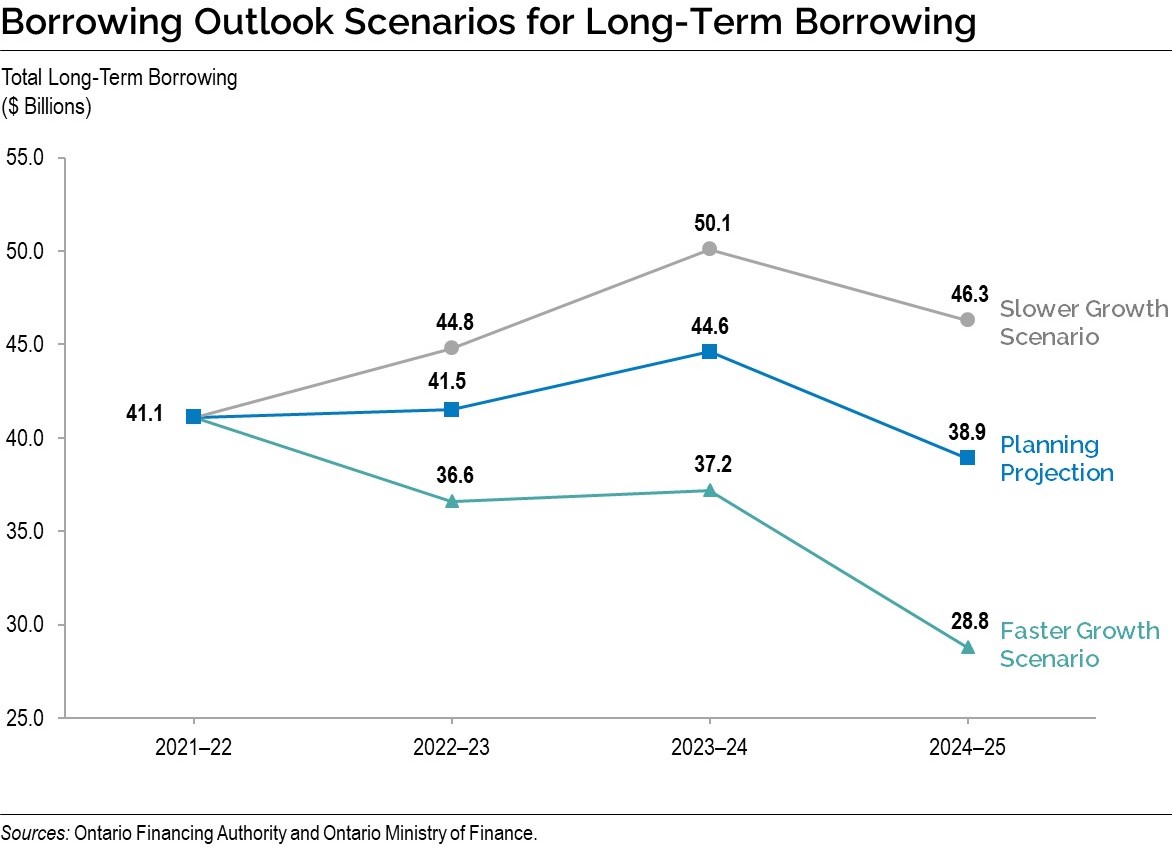
In the event alternative economic scenarios materialize, Ontario’s borrowing requirements in the next three years would also change. Under the Faster Growth scenario, long-term borrowing would decrease by a total of $22.4 billion over the medium-term outlook, while under the Slower Growth scenario, long-term borrowing would increase by $16.2 billion over the same period.
See Chapter 4: Borrowing and Debt Management for more details on Ontario’s borrowing program and debt burden reduction strategy.
Ontario’s Capital Plan
The government’s capital plan is one of the most ambitious in the province’s history, with planned investments over the next 10 years totalling $158.8 billion, including $20.0 billion in 2022–23. This plan is getting shovels in the ground to build highways, hospitals and other critical assets, laying the foundation for a stronger Ontario.
Key highlights in the capital plan include:
Highways
- $25.1 billion over 10 years to support the planning and/or construction of highway expansion and rehabilitation projects across the province, including projects such as:
- Highway 413, a new 400-series highway and transit corridor across Halton, Peel and York regions to support the movement of goods and save drivers up to 30 minutes on their commute, as well as bring relief to the most congested corridor in North America;
- The Bradford Bypass, a new four-lane freeway connecting Highway 400 and Highway 404 in Simcoe County and York Region that is expected to ease gridlock on Highway 400 and local roads, and save commuters up to 35 minutes per trip as compared to existing routes along local roads;
- The QEW Garden City Skyway rehabilitation project, which will include a new twin bridge over the Welland Canal connecting St. Catharines to Niagara-on-the-Lake. This work will keep traffic moving on this strategic trade and economic corridor that links international border crossings with the Greater Golden Horseshoe;
- Early works in Oshawa and Port Hope, as the first step to enable future widening of Highway 401 to relieve congestion starting at Brock Road in Pickering and through Eastern Ontario;
- Continuing the next phase of construction for the new Highway 7 between Kitchener and Guelph, which will provide relief to the gridlocked Highway 401 and connect the fast-growing urban centres of Kitchener, Waterloo and Guelph;
- Widening of Highway 17 from Arnprior to Renfrew to four lanes, which will increase capacity as well as enhance road safety for travellers by separating opposing traffic and providing additional passing opportunities; and
- The Timmins Connecting Link to reconstruct an approximately 21.4-kilometre stretch of Highway 101, which is one of the longest connecting links in Ontario and used by 25,000 vehicles per day.
Transit
- $61.6 billion over 10 years for public transit, including:
- Breaking ground on the Ontario Line, which will provide rapid transit between Exhibition/Ontario Place and the Ontario Science Centre, connecting more than 40 other transit routes, including GO train lines, existing Toronto Transit Commission (TTC) subway and streetcar lines, and the Eglinton Crosstown Light Rail Transit line;
- The Bowmanville GO Rail Extension, which will expand GO Transit rail services from Oshawa into Bowmanville on the Lakeshore East corridor and help reduce gridlock;
- The London GO Rail Service, which will provide weekday GO train trips between London and Union Station in Toronto;
- Planning and design work for a connection of the Eglinton Crosstown West Extension to Toronto Pearson International Airport, to establish connectivity of the line to the airport and one of Ontario’s largest economic and employment zones;
- Advancing planning work for the Sheppard Subway Extension that will connect the existing terminus at Don Mills Station (TTC’s Line 4) with the future Scarborough Subway Extension, delivering smarter, better and faster transit; and
- Transforming the GO Transit network into a modern, reliable and fully integrated rapid transit network that will cut down commute times across the province by steadily increasing service with faster trains, more stations and seamless connections.
Health
- More than $40 billion over the next 10 years in hospital infrastructure, including about $27 billion in capital grants. This is $10 billion more for hospitals and health care centre infrastructure than the commitment in the 2021 Budget. These investments will increase capacity in hospitals, build new health care facilities, and renew existing hospitals and community health centres. Significant new investments are being made to support major hospital projects currently under construction or in various stages of planning to increase capacity, which include:
- Transformation of the existing site and urgent care centre into a new 24/7 inpatient care hospital at Peel Memorial, in partnership with William Osler Health System. This will enable future development of an emergency department and meet the growth needs of one of Ontario’s fastest growing communities;
- Support for the redevelopment of the existing hospital and regional trauma centre on a new site for the Ottawa Hospital – Civic Campus to expand access to programs and services as well as meet bed capacity needs;
- Support for a new state-of-the-art acute care hospital in Windsor and Essex County to add more hospital beds and expand services in the region;
- Funding for the redevelopment of acute care hospitals in Huntsville and Bracebridge to improve community services and access to diagnostic imaging;
- Funding for the planning of the Grand River Hospital and St. Mary’s General Hospital Joint Redevelopment Project to construct a new joint acute care facility and expand to existing facilities in the Kitchener-Waterloo region;
- Support to expand the cardiovascular surgery program at Thunder Bay Regional Health Sciences Centre to address surgical wait times and improve access to lifesaving care;
- Funding to support the single largest hospital infrastructure investment through the Trillium Health Partners – Broader Redevelopment project to build a new, state-of-the-art Mississauga Hospital and expand the Queensway Health Centre;
- Continued support for the construction of a new, modern hospital facility on the existing Uxbridge site at the Oak Valley Health – Uxbridge Hospital to replace the current aged building, and enable the expansion of specialized outpatient clinics as well as the creation of a community health hub with long-term care services;
- Support for the Stevenson Memorial Hospital redevelopment to modernize facilities, support service delivery and respond to future population growth in Simcoe County;
- Construction of new diagnostic imaging, laboratory and emergency departments at the Wallaceburg Sydenham Hospital, part of the Chatham-Kent Health Alliance, to modernize service delivery; and
- Expansion of the Scarborough Health Network – Birchmount site with a new inpatient tower and an expanded emergency department to reduce wait times, improve patient flow and update aging infrastructure.
- Building four new long‐term care homes in Mississauga, Ajax and Toronto under the Long‐Term Care Accelerated Build Pilot. On February 1, 2022, the Lakeridge Gardens long-term care home in Ajax was completed after just 13 months. Construction remains underway for the homes in Mississauga and Toronto.
Broadband
- Nearly $4 billion beginning in 2019–20 to support the government’s commitment to provide high‑speed internet access to every community in Ontario by the end of 2025.
Additional Projects
- Almost $6 billion in the Postsecondary Education sector, including over $2 billion in capital grants over the next 10 years, to help colleges, universities and Indigenous Institutes modernize classrooms by upgrading technology, carrying out critical repairs and improving environmental sustainability.
- Investing $21 billion, including about $14 billion in capital grants over the next 10 years, to support the renewal and expansion of school infrastructure and child care projects, including the new Seaton Public and Catholic elementary schools in Pickering and child care spaces as part of the St. Louis School in Keewatin.
| Sector | Interim2, 3 2021–22 |
Medium-Term Outlook 2022–23 |
Medium-Term Outlook 2023–24 |
Medium-Term Outlook 2024–25 |
10-Year Total4 |
|---|---|---|---|---|---|
| Transportation — Transit | 6,698 | 8,183 | 8,285 | 8,646 | 61,618 |
| Transportation — Provincial Highways | 3,030 | 3,018 | 2,854 | 2,955 | 25,120 |
| Transportation — Other Transportation, Property and Planning | 179 | 219 | 199 | 191 | 1,495 |
| Health — Hospitals | 1,864 | 3,025 | 3,302 | 5,180 | 40,164 |
| Health — Other Health | 192 | 215 | 538 | 838 | 4,723 |
| Education | 2,672 | 2,938 | 2,916 | 2,370 | 21,198 |
| Postsecondary Education — Colleges and Other | 419 | 470 | 529 | 556 | 4,502 |
| Postsecondary Education — Universities | 93 | 135 | 122 | 133 | 1,326 |
| Social | 479 | 319 | 325 | 384 | 2,756 |
| Justice | 400 | 847 | 697 | 304 | 2,736 |
| Other Sectors5 | 2,142 | 3,279 | 2,906 | 2,665 | 16,280 |
| Total Infrastructure Expenditures | 18,167 | 22,647 | 22,672 | 24,221 | 181,918 |
| Less: Other Partner Funding6 | 1,303 | 2,611 | 2,135 | 2,579 | 23,085 |
| Total7 | 16,864 | 20,035 | 20,537 | 21,642 | 158,834 |
Table footnotes:
[1] Includes interest capitalized during construction; third-party investments in hospitals, colleges and schools; federal and municipal contributions to provincially owned infrastructure investments; and transfers to municipalities, universities and non-consolidated agencies.
[2] Interim represents the 2022 Budget projection for the 2021–22 fiscal year.
[3] Includes provincial investment in capital assets of $12.9 billion.
[4] Total reflects the planned infrastructure expenditures for years 2022–23 through to 2031–32.
[5] Includes broadband infrastructure, government administration, natural resources, and culture and tourism industries.
[6] Other Partner Funding refers to third-party investments primarily in hospitals, colleges and schools.
[7] Includes Federal/Municipal contributions to provincial infrastructure investments.
Note: Numbers may not add due to rounding.
Source: Ontario Treasury Board Secretariat.
Footnotes
[1] Parliamentary Budget Officer, Fiscal Sustainability Report 2021, p. 3;
https://www.pbo-dpb.gc.ca/en/blog/news/RP-2122-010-S--fiscal-sustainability-report-2021--rapport-viabilite-financiere-2021
Chart Descriptions
Chart: Program Expense Growth Excluding COVID-19 Time-Limited Funding
The bar chart shows program expense growth from 2019–20 to 2024–25 excluding COVID-19 Time-Limited Funding. For 2019–20, program expense, excluding COVID-19 Time-Limited Funding, is $152.3 billion, $150.0 billion in 2020–21, $162.1 billion in 2021–22, $178.3 billion in 2022–23, $184.8 billion in 2023–24, and $188.1 billion in 2024–25.
There are only three fiscal years from 2019–20 to 2024–25 where COVID-19 Time-Limited Funding is included as part of total program expense. In 2020–21, COVID-19 Time-Limited Funding of $19.1 billion increases total program expense to $169.0 billion. In 2021–22, COVID-19 Time-Limited Funding of $12.0 billion increases total program expense to $174.1 billion. In 2022–23, COVID-19 Time-Limited Funding of $6.9 billion increases total program expense to $185.2 billion.
Note: Numbers may not add due to rounding.
Sources: Ontario Treasury Board Secretariat and Ontario Ministry of Finance.
Chart: Ontario Medium-Term Outlook Scenarios
The bar chart illustrates the range of Ontario deficit outlooks based on the two alternative economic scenarios presented in Chapter 2: Economic Performance and Outlook. The 2022 Budget deficit outlook estimates the deficit to be $19.9 billion in 2022–23, $12.3 billion in 2023–24, and $7.6 billion in 2024–25. Under the Faster Growth scenario, the deficit outlook is estimated to be $15.0 billion in 2022–23 and $4.9 billion in 2023–24, and a surplus of $2.4 billion in 2024–25. Under the Slower Growth scenario, the deficit outlook is estimated to be $23.2 billion in 2022–23, $17.8 billion in 2023–24, and $15.0 billion in 2024–25.
Source: Ontario Ministry of Finance.
Chart: Ontario Recovery Plan Scenarios
The graph illustrates the range of Ontario recovery plan outlooks, based on the two alternative economic scenarios presented in Chapter 2: Economic Performance and Outlook. The 2022 Budget deficit outlook scenario estimates the deficit to be $19.9 billion in 2022–23, $12.3 billion in 2023–24, $7.6 billion in 2024–25, $5.0 billion in 2025–26, and $2.2 billion in 2026–27 before returning to a surplus of $1.3 billion in 2027–28. Under the Faster Growth scenario, the deficit is estimated to be $15.0 billion in 2022–23, and $4.9 billion in 2023–24, before returning to a surplus of $2.4 billion in 2024–25. Under the Slower Growth scenario, the deficit is estimated to be $23.2 billion in 2022–23, $17.8 billion in 2023–24, $15.0 billion in 2024–25, $13.1 billion in 2025–26, $10.8 billion in 2026–27, $8.0 billion in 2027–28, $5.1 billion in 2028–29, and $1.5 billion in 2029–30, before returning to a surplus of $1.8 billion in 2030–31.
Source: Ontario Ministry of Finance.
Chart: Borrowing Outlook Scenarios for Long-Term Borrowing
| Year | 2021–22 | 2022–23 | 2023–24 | 2024–25 |
|---|---|---|---|---|
| Planning Projection | $41.1 | $41.5 | $44.6 | $38.9 |
| Slower Growth Scenario | $41.1 | $44.8 | $50.1 | $46.3 |
| Faster Growth Scenario | $41.1 | $36.6 | $37.2 | $28.8 |
Sources: Ontario Financing Authority andOntario Ministry of Finance.