Ontario’s Economic and Fiscal Outlook in Brief
Ontario’s economy continued to grow in the first half of 2023, supported by strength in the job market. Despite this strong start, Ontario, like other jurisdictions, is not immune to heightened economic and geopolitical uncertainties, the impact of interest rate increases and a slowing global economy.
The 2023 Ontario Economic Outlook and Fiscal Review continues to take a responsible and targeted approach to support people and businesses today and lay a strong fiscal foundation for future generations.
The government is projecting deficits of $5.6 billion in 2023–24 and $5.3 billion in 2024–25 followed by a surplus of $0.5 billion in 2025–26. This reflects updated economic and revenue information and higher contingencies to mitigate near-term risks in 2023–24, and slower economic growth projections in 2024 and 2025.
Ontario’s 2023–24 net debt-to-gross domestic product (GDP) ratio is now forecast to be 38.4 per cent, compared with the forecast of 37.8 per cent projected in the 2023 Budget.
As with any forecast, there are numerous risks that are taken into consideration when determining Ontario’s fiscal plan. The 2023 Ontario Economic Outlook and Fiscal Review is being released when global economic conditions remain uncertain, driven by a variety of factors beyond the government’s control. As a result, the Ontario Ministry of Finance has developed Faster Growth and Slower Growth scenarios that the economy could take over the next several years to provide more transparency about possible impacts on Ontario’s economy and its finances.
Ontario’s Economic Outlook
Ontario’s real GDP is projected to rise 1.1 per cent in 2023, 0.5 per cent in 2024, 2.0 per cent in 2025 and 2.8 per cent in 2026. Since the 2023 Budget, forecasts have been revised upwards for 2023 and lower for 2024 and 2025. For the purposes of prudent fiscal planning, these projections are set slightly below the average of private‐sector forecasts.
| 2022 | 2023p | 2024p | 2025p | 2026p | |
|---|---|---|---|---|---|
| Real GDP Growth | 3.7 | 1.1 | 0.5 | 2.0 | 2.8 |
| Nominal GDP Growth | 9.2 | 3.6 | 2.9 | 4.2 | 4.8 |
| Employment Growth | 4.6 | 2.3 | 0.8 | 1.5 | 1.9 |
| CPI Inflation | 6.8 | 3.7 | 2.5 | 2.1 | 2.0 |
Table footnotes:
p = Ontario Ministry of Finance planning projection based on external sources as of September 29, 2023.
Sources: Statistics Canada and Ontario Ministry of Finance.
Revisions to Outlook Since the 2023 Budget
The outlook over the 2023 to 2026 period has been revised compared to the projections in the 2023 Budget. Key changes since the 2023 Budget include:
- Stronger growth in both real and nominal GDP in 2023 and slower growth between 2024 and 2025, with growth strengthening in 2026;
- Stronger employment growth in 2023 followed by slower job creation in 2024 and 2025;
- Downward revisions to net operating surplus of corporations growth in all years; and
- Higher projected housing starts in all years and weaker home resales in 2023 and 2024, followed by a strong rebound in 2025.
| 2023p: 2023 Budget |
2023p: 2023 FES |
2024p: 2023 Budget |
2024p: 2023 FES |
2025p: 2023 Budget |
2025p: 2023 FES |
2026p: 2023 Budget |
2026p: 2023 FES |
|
|---|---|---|---|---|---|---|---|---|
| Real Gross Domestic Product | 0.2 | 1.1 | 1.3 | 0.5 | 2.5 | 2.0 | 2.4 | 2.8 |
| Nominal Gross Domestic Product | 2.8 | 3.6 | 3.6 | 2.9 | 4.6 | 4.2 | 4.5 | 4.8 |
| Compensation of Employees | 5.1 | 6.3 | 4.2 | 3.9 | 4.5 | 4.6 | 4.2 | 4.4 |
| Net Operating Surplus — Corporations | (8.2) | (9.2) | (0.5) | (3.1) | 9.2 | 4.9 | 9.1 | 7.5 |
| Nominal Household Consumption | 5.1 | 5.4 | 4.1 | 3.6 | 4.3 | 4.2 | 4.2 | 4.7 |
| Other Economic Indicators — Employment | 0.5 | 2.3 | 1.0 | 0.8 | 1.7 | 1.5 | 1.7 | 1.9 |
| Other Economic Indicators — Job Creation (000s) | 39 | 176 | 78 | 63 | 133 | 120 | 136 | 154 |
| Other Economic Indicators — Unemployment Rate (Per Cent) | 6.4 | 5.6 | 6.6 | 6.4 | 6.3 | 6.2 | 6.3 | 5.8 |
| Other Economic Indicators — Consumer Price Index | 3.6 | 3.7 | 2.1 | 2.5 | 2.0 | 2.1 | 2.0 | 2.0 |
| Other Economic Indicators — Housing Starts (000s)1 | 80.3 | 89.5 | 79.3 | 84.5 | 82.7 | 89.2 | 83.2 | 94.4 |
| Other Economic Indicators — Home Resales | (8.9) | (11.7) | 21.0 | 11.5 | 1.2 | 22.5 | 1.2 | 1.2 |
| Other Economic Indicators — Home Resale Prices | (9.7) | (4.6) | 2.2 | 1.3 | 4.0 | 3.6 | 4.0 | 4.0 |
| Key External Variables — U.S. Real Gross Domestic Product | 0.5 | 2.2 | 1.2 | 1.1 | 2.1 | 1.7 | 2.1 | 2.1 |
| Key External Variables — WTI Crude Oil ($US per Barrel) | 83 | 78 | 80 | 79 | 79 | 77 | 79 | 78 |
| Key External Variables — Canadian Dollar (Cents US) | 74.4 | 74.4 | 76.5 | 75.8 | 77.6 | 77.0 | 78.5 | 77.9 |
| Key External Variables — Three-Month Treasury Bill Rate2 | 4.3 | 4.8 | 3.3 | 4.4 | 2.5 | 2.9 | 2.4 | 2.6 |
| Key External Variables — 10-Year Government Bond Rate3 | 3.1 | 3.3 | 3.1 | 3.3 | 3.1 | 3.2 | 3.2 | 3.2 |
Table footnotes:
p = Ontario Ministry of Finance planning projection based on external sources as of September 29, 2023.
[1] Housing starts projection based on private-sector average as of September 29, 2023.
[2], [3] Government of Canada interest rates (per cent).
Sources: Statistics Canada; Canada Mortgage and Housing Corporation; Canadian Real Estate Association; Bank of Canada; United States Bureau of Economic Analysis; Blue Chip Economic Indicators (October 2023); U.S. Energy Information Administration; and Ontario Ministry of Finance.
A Strong Foundation for the Next Generation
The government is providing the people of Ontario with a clear view into the province's finances, outlining its strategy to build a strong and resilient Ontario for both current and future generations.
The government’s plan is consistent with the Fiscal Sustainability, Transparency and Accountability Act, 2019 and its governing principles that guide Ontario’s fiscal policy.
- Transparent: The government continues to be transparent through the release of regular fiscal updates. For the sixth year in a row, the Auditor General of Ontario has provided a clean audit opinion on the government’s consolidated financial statements.
- Responsible: The government has developed a measured and responsible approach to managing Ontario’s finances that is driven by economic growth, while investing in key public services and capital projects that will help improve economic productivity and create jobs.
- Flexible: The government’s plan has built in appropriate levels of prudence in the form of contingency funds and a reserve to ensure it has the necessary fiscal flexibility to respond to changing circumstances.
- Equitable: The government’s plan strengthens critical public services, such as health, education and key infrastructure, for the people of today and ensures they are maintained for the benefit of future generations.
- Sustainable: The government will continue to take a flexible approach to respond to the ongoing economic uncertainty while ensuring the long-term sustainability of Ontario’s finances.
Ontario’s Fiscal Plan
In 2023–24, the government is projecting a deficit of $5.6 billion. Over the medium term, the government is forecasting a deficit of $5.3 billion in 2024–25 and a surplus of $0.5 billion in 2025–26.
| Actual 2022–23 |
Current Outlook 2023–24 |
Medium-Term Outlook 2024–25 |
Medium-Term Outlook 2025–26 |
|
|---|---|---|---|---|
| Revenue — Personal Income Tax | 44.2 | 49.4 | 51.2 | 54.3 |
| Revenue — Sales Tax | 36.1 | 37.7 | 38.7 | 40.7 |
| Revenue — Corporations Tax | 27.8 | 26.0 | 25.8 | 27.4 |
| Revenue — Ontario Health Premium | 4.4 | 4.8 | 5.0 | 5.2 |
| Revenue — Education Property Tax | 6.0 | 5.7 | 5.8 | 5.8 |
| Revenue — All Other Taxes | 18.0 | 17.5 | 19.4 | 21.5 |
| Total Taxation Revenue | 136.5 | 141.2 | 145.8 | 154.8 |
| Revenue — Government of Canada | 31.3 | 35.1 | 35.4 | 37.0 |
| Revenue — Income from Government Business Enterprises | 6.1 | 6.8 | 6.5 | 8.4 |
| Revenue — Other Non-Tax Revenue | 19.0 | 18.7 | 19.0 | 19.8 |
| Total Revenue | 192.9 | 201.8 | 206.7 | 220.0 |
| Base Programs1 — Health Sector | 75.1 | 81.2 | 84.2 | 87.6 |
| Base Programs2 — Education Sector3 | 33.6 | 34.7 | 36.4 | 37.5 |
| Base Programs4 — Postsecondary Education Sector | 11.6 | 12.1 | 12.5 | 13.0 |
| Base Programs5 — Children, Community and Social Services Sector | 18.1 | 19.4 | 19.9 | 19.9 |
| Base Programs6 — Justice Sector | 5.3 | 5.5 | 5.3 | 5.2 |
| Base Programs7 — Other Programs | 30.1 | 40.1 | 37.8 | 39.1 |
| Total Base Programs | 173.8 | 193.0 | 196.2 | 202.3 |
| COVID‑19 Time-Limited Funding | 6.3 | – | – | – |
| Other One-Time Expenses | 6.3 | – | – | – |
| Total Programs | 186.4 | 193.0 | 196.2 | 202.3 |
| Interest on Debt | 12.4 | 13.4 | 14.3 | 15.2 |
| Total Expense | 198.8 | 206.4 | 210.5 | 217.5 |
| Surplus/(Deficit) Before Reserve | (5.9) | (4.6) | (3.8) | 2.5 |
| Reserve | – | 1.0 | 1.5 | 2.0 |
| Surplus/(Deficit) | (5.9) | (5.6) | (5.3) | 0.5 |
| Net Debt as a Per Cent of GDP | 38.3% | 38.4% | 39.1% | 38.7% |
| Net Debt as a Per Cent of Revenue | 207.6% | 206.2% | 210.8% | 204.2% |
| Interest on Debt as Per Cent of Revenue | 6.4% | 6.7% | 6.9% | 6.9% |
Table footnotes:
[1], [2], [4], [5], [6], [7] For presentation purposes in the 2023 Ontario Economic Outlook and Fiscal Review, one-time COVID-19-related spending in 2022–23 has been included within COVID-19 Time-Limited Funding. This funding will no longer be reported separately, starting in 2023–24.
[3] Excludes Teachers’ Pension Plan. Teachers’ Pension Plan expense is included in Other Programs.
Notes: Numbers may not add due to rounding. Current and medium-term outlook primarily reflect information available as of September 29, 2023.
Sources: Ontario Treasury Board Secretariat and Ontario Ministry of Finance.
Revenue Outlook Over the Medium Term
Ontario’s revenue outlook is anchored by an economic projection based on private-sector forecasts and the best available information at the time of finalizing the planning projection. Details of the medium-term revenue outlook are outlined later in this document. See Chapter 3: A Strong Foundation for the Next Generation: Ontario’s Fiscal Plan and Outlook for further details.
Key inputs included in the revenue forecast are a prudent economic outlook based on private-sector forecasts; existing federal–provincial agreements and funding formulas; and the business plans of government ministries, business enterprises and service organizations.
Program Expense Outlook Over the Medium Term
The government is building a strong fiscal foundation while continuing to invest in critical public services. In 2023–24, program expense is projected to increase by $6.6 billion compared to 2022–23, or 3.5 per cent. Between 2023–24 and 2025–26, program expense is projected to increase every year, growing at an average annual rate of 2.4 per cent as the government continues to invest in critical programs in health care, education and infrastructure. Significant contingencies are included within the program expense outlook to manage unforeseen risks
See Chapter 3: A Strong Foundation for the Next Generation: Ontario’s Fiscal Plan and Outlook for further details on the program expense outlook over the medium term.
Interest on Debt Outlook Over the Medium Term
Ontario is forecast to pay $13.4 billion in interest costs in 2023–24, $14.3 billion in 2024–25 and $15.2 billion in 2025–26. Over this period, cumulative interest on debt expense is $0.7 billion below the 2023 Budget forecast.
See Chapter 4: Borrowing and Debt Management for further details on the interest on debt outlook over the medium term.
Other Fiscal Planning Assumptions
The reserve is set at $1.0 billion in 2023–24, $1.5 billion in 2024–25 and $2.0 billion in 2025–26.
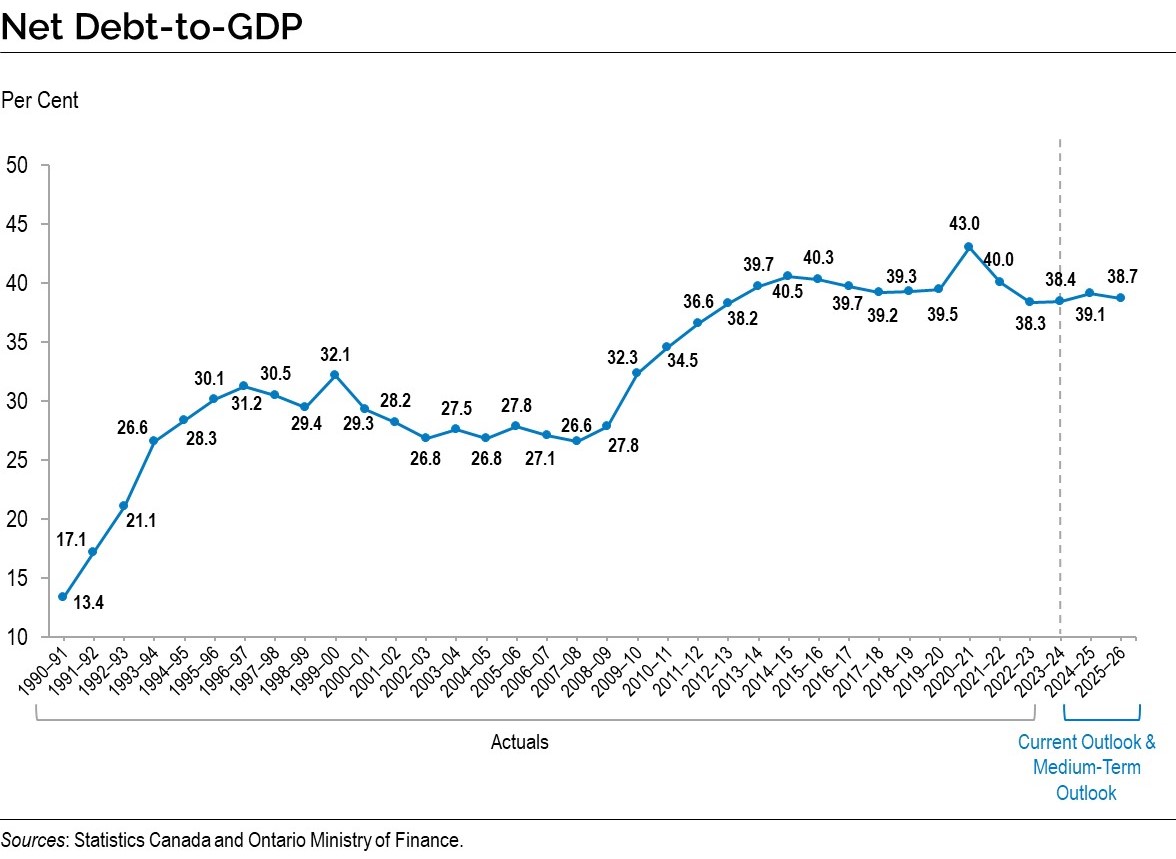
Net debt-to-GDP for 2023–24 is projected to be 38.4 per cent. Over the medium term, the net debt-to-GDP ratio is forecast to be 39.1 per cent in 2024–25 and 38.7 per cent in 2025–26.
Economic and Fiscal Outlook Scenarios
In recognition of continued economic uncertainty, the Ontario Ministry of Finance has once again developed Faster Growth and Slower Growth scenarios that the economy could take over the next several years. These alternative scenarios should not be considered the best case or the worst case. Rather, they illustrate a broader range of possible outcomes.
| 2023p | 2024p | 2025p | 2026p | |
|---|---|---|---|---|
| Faster Growth Scenario | 1.7 | 2.1 | 2.3 | 3.1 |
| Planning Projection | 1.1 | 0.5 | 2.0 | 2.8 |
| Slower Growth Scenario | 0.7 | (0.9) | 1.9 | 2.7 |
Table footnotes:
p = Ontario Ministry of Finance planning projection based on external sources and alternative scenarios.
Source: Ontario Ministry of Finance.
| 2023p | 2024p | 2025p | 2026p | |
|---|---|---|---|---|
| Faster Growth Scenario | 4.5 | 5.3 | 4.7 | 5.3 |
| Planning Projection | 3.6 | 2.9 | 4.2 | 4.8 |
| Slower Growth Scenario | 2.9 | 0.7 | 3.9 | 4.5 |
Table footnotes:
p = Ontario Ministry of Finance planning projection based on external sources and alternative scenarios.
Source: Ontario Ministry of Finance.
In the event that the alternative economic scenarios materialize, as opposed to the Planning Projection, Ontario’s fiscal plan would also change as a result.
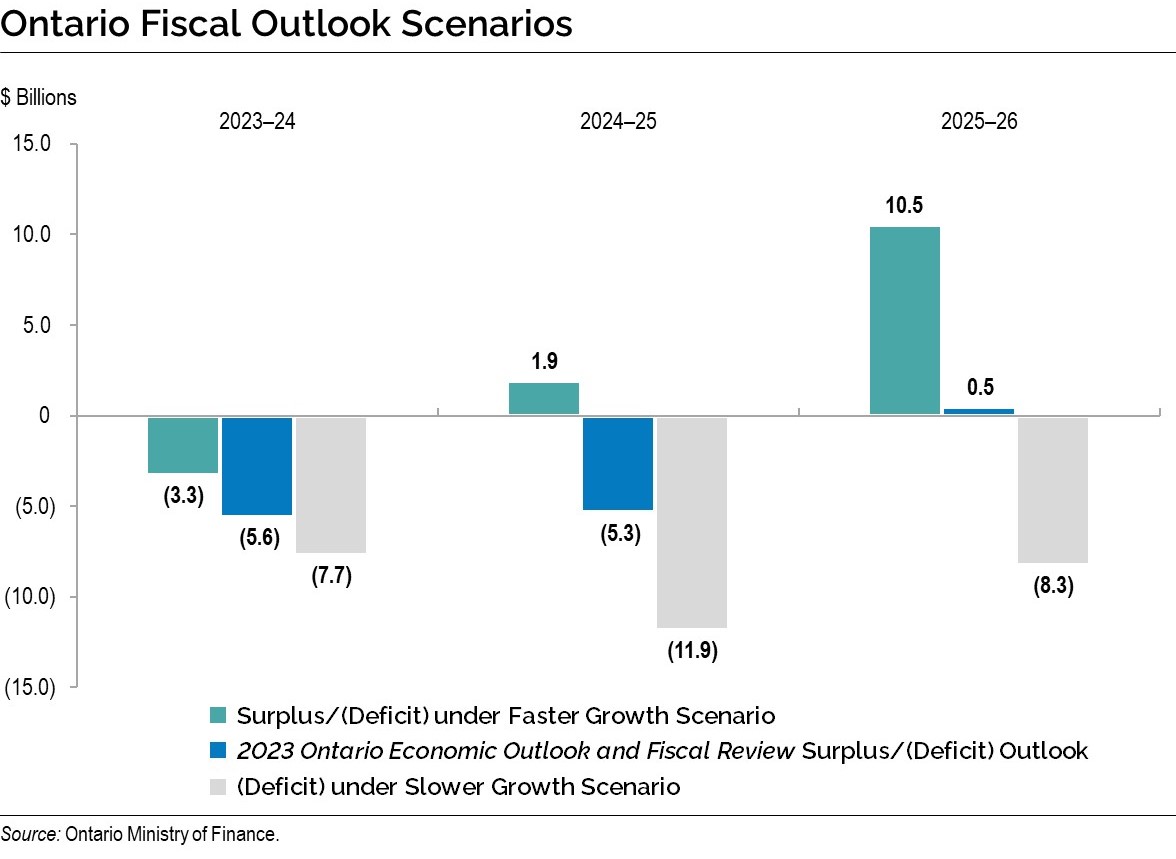
Under the Faster Growth scenario, the deficit outlook may improve to $3.3 billion in 2023–24, and reach surpluses of $1.9 billion in 2024–25 and $10.5 billion in 2025–26. However, under the Slower Growth scenario, the deficit outlook may deteriorate to $7.7 billion in 2023–24, $11.9 billion in 2024–25, and $8.3 billion in 2025–26. In these alternative outlook scenarios, program expenditures are assumed to be unchanged compared to the medium-term expense outlook and only revenue and interest on debt are adjusted.
The heightened economic and geopolitical uncertainties facing Ontario underscore the need for a responsible and flexible fiscal plan to respond to uncertainty and risk. See Chapter 3, Economic and Fiscal Outlook Scenarios section for further details.
Borrowing and Debt Management
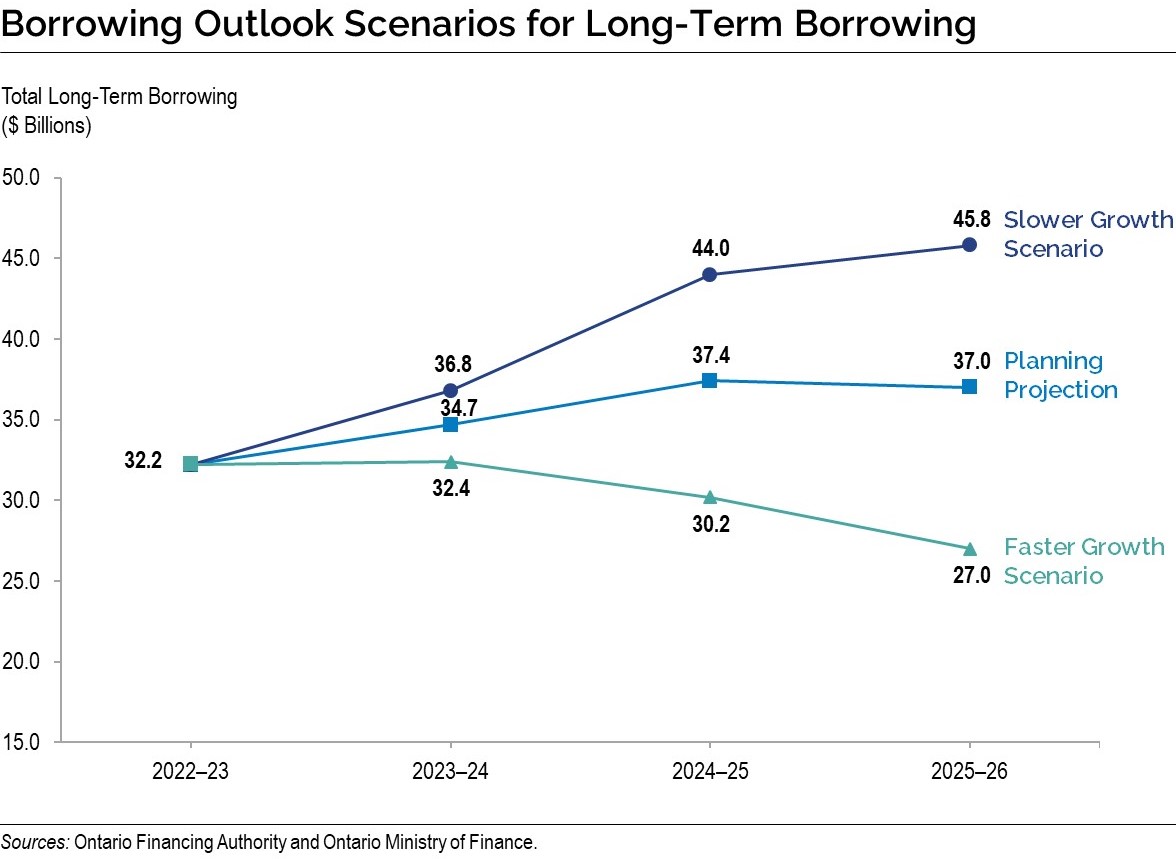
Ontario’s long-term public borrowing for 2023–24 is now forecast to be $34.7 billion, $7.2 billion more than the 2023 Budget forecast. This is primarily due to higher than previously forecast deficits in 2022–23 and 2023–24. As of October 12, 2023, Ontario had completed $15.0 billion, or 43 per cent of its 2023–24 total long-term public borrowing program. Ontario’s borrowing program is also driven by a historic capital plan. See section A Capital Plan for a Stronger Ontario for further details.
| 2023 Budget |
In-Year Change |
Current Outlook 2023–24 |
Medium-Term Outlook 2024–25 |
Medium-Term Outlook 2025–26 |
|
|---|---|---|---|---|---|
| Deficit/(Surplus) | 1.3 | 4.3 | 5.6 | 5.3 | (0.5) |
| Investment in Capital Assets | 13.6 | 0.0 | 13.6 | 18.7 | 19.0 |
| Non-Cash and Cash Timing Adjustments | (9.2) | 7.9 | (1.3) | (11.2) | (12.0) |
| Loans to Infrastructure Ontario | 0.1 | – | 0.1 | 0.1 | 0.2 |
| Other Net Loans/Investments | 0.1 | (0.0) | 0.1 | (1.0) | (0.2) |
| Debt Maturities/Redemptions | 31.2 | (0.0) | 31.2 | 28.0 | 33.1 |
| Total Funding Requirement | 37.0 | 12.2 | 49.2 | 39.9 | 39.5 |
| Decrease/(Increase) in Short-Term Borrowing | – | – | – | (2.5) | (2.5) |
| Increase/(Decrease) in Cash and Cash Equivalents | 5.0 | (5.0) | – | – | – |
| Pre-borrowing in 2022–23 for 2023–24 | (14.5) | – | (14.5) | – | – |
| Total Long-Term Public Borrowing | 27.5 | 7.2 | 34.7 | 37.4 | 37.0 |
Table footnotes:
Note: Numbers may not add due to rounding.
Source: Ontario Financing Authority.
Ontario is forecast to pay $13.4 billion in interest costs in 2023–24, $0.6 billion lower than the 2023 Budget forecast.
Interest on debt in 2024–25 and 2025–26 is forecast to be $14.3 billion and $15.2 billion, compared to the 2023 Budget forecast of $14.4 billion and $15.1 billion, respectively.
A one percentage point change in interest rates either up or down from the current interest rate forecast is estimated to have a corresponding change in Ontario’s borrowing costs by around $700 million in the first full year.
The net debt-to-GDP ratio in 2023–24 is now projected to be 38.4 per cent, or 0.6 percentage points higher than the 37.8 per cent forecast in the 2023 Budget, which is mainly due to higher than previously projected deficits. Over the medium-term outlook, the net debt-to-GDP ratio is projected to remain modestly higher than the forecasts contained in the 2023 Budget.
As described earlier in the Economic and Fiscal Outlook Scenarios section, in the event that alternative economic scenarios materialize, Ontario’s borrowing requirements in the next three years would also change as a result. Under the Faster Growth scenario, long-term borrowing would decrease by $19.6 billion over the three-year outlook period, while under the Slower Growth scenario, long-term borrowing would increase by $17.3 billion over the same period.
A Capital Plan for a Stronger Ontario
Ontario’s Plan to Build includes the most ambitious capital plan in Ontario’s history, with planned investments over the next 10 years totalling $185.0 billion, including $20.7 billion in 2023–24. This plan is getting shovels in the ground to build highways, hospitals and other critical assets for a growing population, as well as laying the foundation for a strong Ontario. The Ontario Infrastructure Bank will invest in sector specific projects that will help address the infrastructure deficit and support the province’s growth. See Chapter 1,Section A: Building Ontario for further details.
Key highlights in the capital plan include:
Highways
$28.1 billion over 10 years to support the highway network including the planning and/or construction of new and expanded highways across the province, such as:
- Highway 413, a new 400‐series highway and transportation corridor across Halton, Peel and York regions that will bring relief to one of the busiest corridors in North America and save drivers up to 30 minutes each way on their commute during rush hour;
- Bradford Bypass, a new four‐lane freeway connecting Highway 400 in Simcoe County and Highway 404 in York Region, which will save drivers an estimated 35 minutes in travel time;
- The QEW Garden City Skyway Bridge Twinning project, which includes construction of a new bridge on the QEW over the Welland Canal connecting the City of St. Catharines to the Town of Niagara‐on‐the‐Lake;
- The expanded Highway 7 will provide relief to the gridlocked Highway 401 and connect the fast‑growing urban centres of Kitchener, Waterloo and Guelph;
- Enabling the expansion of Highway 401 east from Brock Road in Pickering to help relieve gridlock for tens of thousands of drivers per day and get goods moving faster; and
- Widening existing corridors across the province, such as Highway 3 between Essex and Leamington, Highway 11/17 between Thunder Bay and Nipigon and Highway 17 between Kenora and the Manitoba border.
Transit
$70.7 billion over 10 years to build new and expanded public transit across the province, including:
- Transforming the GO Transit rail network into a modern, reliable and fully integrated rapid transit network. GO expansion will improve access and convenience across the Greater Golden Horseshoe by steadily increasing service with two-way all-day GO train service across the core network with faster trains, more stations and better connections;
- Making investments to expand GO Transit rail service to Bowmanville;
- Increasing GO train service between Union Station and the Niagara Region, with more express service between Hamilton, Burlington and Toronto. The government also re-introduced year‑round weekend GO train service between Union Station in Toronto and Niagara Falls. The service includes three round trips every day of the week, offering travellers a faster, more direct journey between downtown Toronto and one of Canada’s top tourist destinations;
- Awarding two major contracts and releasing two Requests for Proposals (RFPs) for the Ontario Line, which will provide rapid transit from Exhibition/Ontario Place to Eglinton Avenue and Don Mills Road as well as connect more than 40 other transit routes, including GO train lines, subway and streetcar lines and the Eglinton Crosstown;
- Continuing tunnelling for the three‐stop Scarborough Subway Extension from Kennedy Station to Sheppard Avenue and McCowan Road and awarding the contract for design and construction of new underground stations with bus terminals;
- Continuing tunnelling on the Eglinton Crosstown West Extension. As of September 2023, the two boring machines have completed more than half the tunnelling of a combined 8.2 kilometres; and
- Purchasing three new trainsets to restore the Northlander passenger rail service to provide a safe and reliable transportation option for Northern communities, which will also support industries and resource sectors.
Health
More than $48 billion over the next 10 years in health infrastructure, including over $32 billion in capital grants, to support more than 50 hospital projects that would add 3,000 new beds over 10 years to increase access to reliable, quality care. Investments are being made to support hospital projects, including:
- Transformation of the existing site and urgent care centre into a new 24/7 inpatient care hospital at Peel Memorial in Brampton, in partnership with the William Osler Health System. This will allow development of an emergency department and meet the evolving needs of one of Ontario’s fastest growing communities;
- Funding to support the Trillium Health Partners Broader Redevelopment Project to build a new, state‐of‐the‐art hospital, the Peter Gilgan Mississauga Hospital and the expansion of the Queensway site;
- Support for the construction of a new, modern hospital facility on the existing Uxbridge site at the Oak Valley Health – Uxbridge Hospital to replace the current aged building, and enable the expansion of specialized outpatient clinics as well as the creation of a community health hub with long-term care services;
- Expansion of the Scarborough Health Network – Birchmount Hospital with a new inpatient tower and an expanded emergency department to reduce wait times, improve patient flow and update aging infrastructure;
- Support for the construction of a new state-of-the-art patient tower at University Health Network – Toronto Western Hospital that will add more than 80 net new beds and 20 new operating rooms;
- Support for a new state-of-the-art acute care hospital in Windsor and Essex County to add more hospital beds and expand services in the region;
- Support for redevelopment of the existing hospital and regional trauma centre on a new site for the Ottawa Hospital – Civic Campus to expand access to programs and services as well as meet bed capacity needs; and
- Support the Runnymede Healthcare Centre’s First Responders Wellness and Rehabilitation Centre to break down barriers in accessing treatment for post-traumatic stress injury and other concurrent mental health disorders.
Long-Term Care
- Advanced construction on 11,199 beds (67 projects) to start between April 1, 2022 and August 31, 2023 by providing a supplemental increase to the construction funding subsidy to stimulate the start of construction for more long-term care homes across Ontario;
- Planned investments that total a historic $6.4 billion since 2019 to build more than 30,000 new and upgrade over 28,000 long‐term care beds across the province by 2028 to modern design standards. As of September 2023, 18,204 beds (110 projects) are either completed/open, under construction, or have the approval to start construction; and
- Progress in building long-term care homes continues under the Accelerated Build Pilot Program:
- In March 2022, Lakeridge Gardens (Lakeridge Health) in Ajax opened to residents as the first home under the Accelerated Build Pilot Program, adding 320 new beds to the long-term care sector.
- In May 2023, Humber Meadows (Humber River Hospital) in Toronto opened, adding 320 new beds to the long-term care sector.
- Wellbrook Place (Trillium Health Partners) in Mississauga is expected to open to residents in fall 2023, adding a total of 632 beds to the long-term care sector.
Broadband
- Nearly $4 billion beginning in 2019–20 to ensure every community across the province has access to high-speed internet by the end of 2025. Multiple broadband programs are supporting this goal to help people work, learn or connect with their loved ones, including the Southwestern Integrated Fibre Technology (SWIFT) and Eastern Ontario Regional Network initiatives.
Education
- Investing $22 billion over the next 10 years, including about $15 billion in capital grants, to build more schools and child care spaces as well as the renewal of existing schools. New projects include an English public elementary school in Sudbury, a joint French public and Catholic secondary school in Kingston, an English Catholic elementary school in Kitchener, an English public elementary school in Windsor and a new addition to the École secondaire Jeunes sans frontières in Brampton.
Postsecondary Education
- $5.4 billion in the Postsecondary Education sector over the next 10 years, including over $2 billion in capital grants, to help colleges, universities and Indigenous Institutes modernize classrooms by upgrading technology, supporting critical repairs and improving energy efficiency.
| Sector | Current Outlook2, 3 2023–24 |
Medium-Term Outlook 2024–25 |
Medium-Term Outlook 2025–26 |
10-Year Total4 |
|---|---|---|---|---|
| Transportation — Transit | 7,471 | 11,892 | 10,150 | 70,728 |
| Transportation — Provincial Highways | 3,193 | 3,459 | 3,724 | 28,098 |
| Transportation — Other Transportation, Property and Planning | 236 | 192 | 167 | 1,270 |
| Health — Hospitals | 3,349 | 3,795 | 5,687 | 48,119 |
| Health — Other Health | 573 | 368 | 1,297 | 8,464 |
| Education | 3,003 | 2,923 | 2,801 | 22,062 |
| Postsecondary Education — Colleges and Other | 705 | 650 | 495 | 4,082 |
| Postsecondary Education — Universities | 124 | 114 | 132 | 1,309 |
| Social | 394 | 381 | 472 | 2,645 |
| Justice | 851 | 790 | 423 | 3,036 |
| Other Sectors5 | 3,638 | 3,192 | 3,235 | 16,740 |
| Total Infrastructure Expenditures | 23,536 | 27,756 | 28,583 | 206,555 |
| Less: Other Partner Funding6 | 2,864 | 1,741 | 1,482 | 21,506 |
| Total7 | 20,672 | 26,015 | 27,100 | 185,049 |
Table footnotes:
[1] Includes interest capitalized during construction; third-party investments in hospitals, colleges and schools; federal and municipal contributions to provincially owned infrastructure investments; and transfers to municipalities, universities and non-consolidated agencies.
[2] Includes $573 million in interest capitalized during construction.
[3] Includes provincial investment in capital assets of $13.6 billion.
[4] Total reflects the planned infrastructure expenditures for years 2023–24 through 2032–33.
[5] Includes broadband infrastructure, government administration, natural resources, and the culture and tourism industries.
[6] Other Partner Funding refers to third-party investments primarily in hospitals, colleges and schools.
[7] Includes federal–municipal contributions to provincial infrastructure investments.
Note: Numbers may not add due to rounding.
Source: Ontario Treasury Board Secretariat.
Chart Descriptions
Ontario Fiscal Outlook Scenarios
The bar chart illustrates the range of Ontario deficit outlooks based on the two alternative economic scenarios presented in Chapter 2: Economic Performance and Outlook. The 2023 Ontario Economic Outlook and Fiscal Review fiscal outlook estimates the deficits to be $5.6 billion in 2023–24 and $5.3 billion in 2024–25, before reaching a surplus of $0.5 billion in 2025–26. Under the Faster Growth scenario, the deficit is estimated to be $3.3 billion in 2023–24, followed by surpluses of $1.9 billion in 2024–25 and $10.5 billion in 2025–26. Under the Slower Growth scenario, the deficits are estimated to be $7.7 billion in 2023–24, $11.9 billion in 2024–25 and $8.3 billion in 2025–26.
Source: Ontario Ministry of Finance.
Net Debt-to-GDP
Ontario’s net debt-to-GDP ratio is forecast to be 38.4 per cent in 2023–24.
| Year | Net Debt-to-GDP (%) |
|---|---|
| 1990–91 | 13.4 |
| 1991–92 | 17.1 |
| 1992–93 | 21.1 |
| 1993–94 | 26.6 |
| 1994–95 | 28.3 |
| 1995–96 | 30.1 |
| 1996–97 | 31.2 |
| 1997–98 | 30.5 |
| 1998–99 | 29.4 |
| 1999–00 | 32.1 |
| 2000–01 | 29.3 |
| 2001–02 | 28.2 |
| 2002–03 | 26.8 |
| 2003–04 | 27.5 |
| 2004–05 | 26.8 |
| 2005–06 | 27.8 |
| 2006–07 | 27.1 |
| 2007–08 | 26.6 |
| 2008–09 | 27.8 |
| 2009–10 | 32.3 |
| 2010–11 | 34.5 |
| 2011–12 | 36.6 |
| 2012–13 | 38.2 |
| 2013–14 | 39.7 |
| 2014–15 | 40.5 |
| 2015–16 | 40.3 |
| 2016–17 | 39.7 |
| 2017–18 | 39.2 |
| 2018–19 | 39.3 |
| 2019–20 | 39.5 |
| 2020–21 | 43.0 |
| 2021–22 | 40.0 |
| 2022–23 | 38.3 |
| 2023–24 | 38.4 |
| 2024–25 | 39.1 |
| 2025–26 | 38.7 |
Sources: Statistics Canada and Ontario Ministry of Finance.
Borrowing Outlook Scenarios for Long-Term Borrowing
| Year | 2022–23 | 2023–24 | 2024–25 | 2025–26 |
|---|---|---|---|---|
| Planning Projection | 32.2 | 34.7 | 37.4 | 37.0 |
| Slower Growth Scenario | 32.2 | 36.8 | 44.0 | 45.8 |
| Faster Growth Scenario | 32.2 | 32.4 | 30.2 | 27.0 |
Sources: Ontario Financing Authority and Ontario Ministry of Finance.