Ontario’s Economic and Fiscal Outlook in Brief
Ontario, like the rest of the world, continues to face economic challenges and elevated uncertainty. The outcomes of persistently high interest rates and inflation continue to be unclear. However, Ontario’s economy has demonstrated continued resiliency in light of ongoing economic pressures. By taking a responsible approach to fiscal management while creating stronger communities for future generations, the government is continuing to make progress on its plan to build Ontario together.
Ontario’s economy performed stronger than expected in 2023, despite continued economic headwinds prompted by elevated consumer price inflation and high interest rates. Nearly all private-sector forecasters expect continued but slower growth in 2024, compared to the projection in the 2023 Budget.
Ontario also experienced above average employment growth in 2023, adding 183,200 net new jobs, a 2.4 per cent increase. Ontario’s unemployment rate rose modestly to 5.7 per cent in 2023 but remained low compared to its historic average.
The government’s plan retains a path to balance the budget despite a fiscal deterioration relative to Ontario’s 2023 Budget and the outlook in the fall 2023 Ontario Economic Outlook and Fiscal Review. While slower projected growth in 2024 and other factors beyond the province’s control are key drivers of the deterioration, the government is continuing to invest in key public services and not raising taxes or fees to increase revenues at a time when it is important to keep costs down for people and businesses.
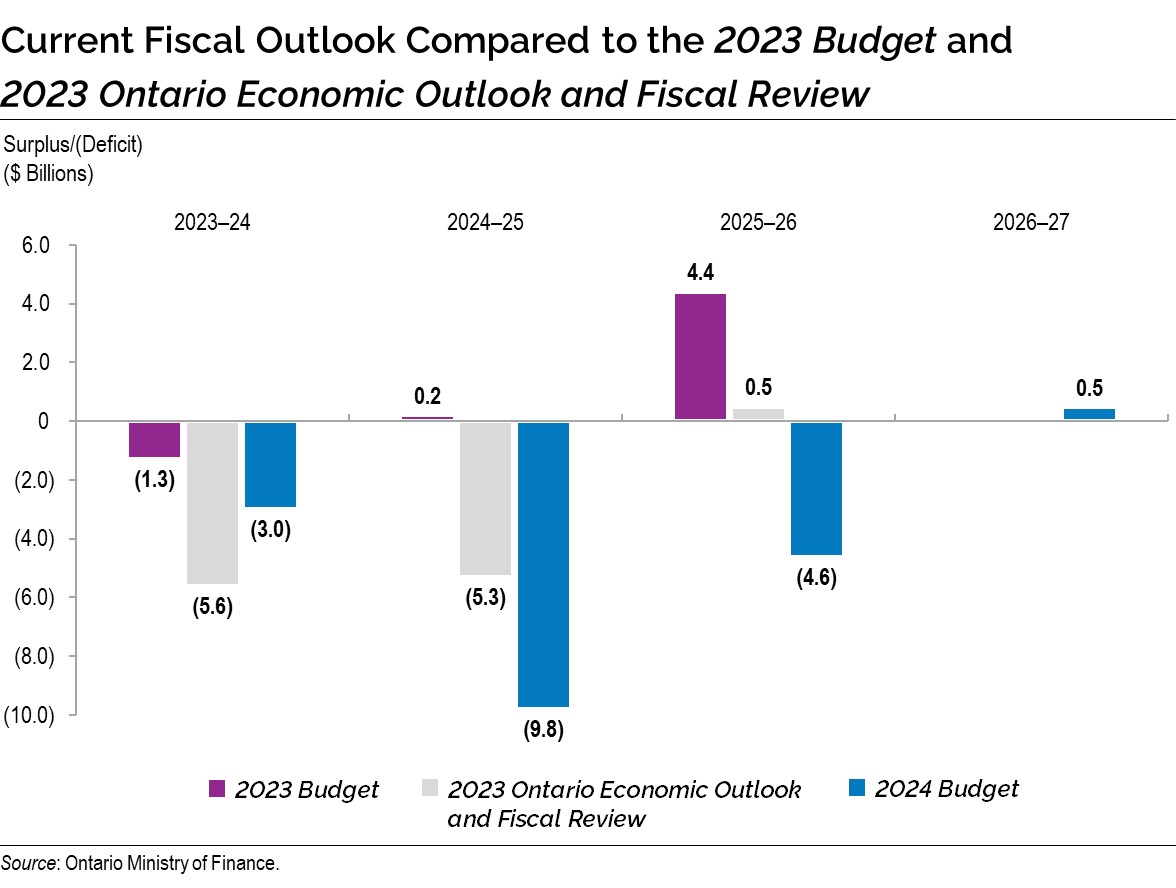
In 2023–24, Ontario is projecting a deficit of $3.0 billion. Over the medium term, the government is projecting deficits of $9.8 billion in 2024–25 and $4.6 billion in 2025–26 before planning for a surplus of $0.5 billion in 2026–27. The future pace of economic growth remains uncertain, which may impact these projections.
The government will continue to support people and businesses in Ontario and make prudent and targeted investments to build a strong future together.
Ontario’s Economic Outlook
High interest rates are expected to continue negatively impacting Ontario’s economy in 2024, with real gross domestic product (GDP) growth projected to slow from an estimated 1.2 per cent in 2023 to 0.3 per cent in 2024. Real GDP growth is projected to accelerate to 1.9 per cent in 2025, and 2.2 per cent in 2026 and 2027. For the purposes of prudent fiscal planning, these projections are slightly below the average of private‐sector forecasts.
| 2022 | 2023 | 2024p | 2025p | 2026p | 2027p | |
|---|---|---|---|---|---|---|
| Real GDP Growth | 3.9 | 1.2e | 0.3 | 1.9 | 2.2 | 2.2 |
| Nominal GDP Growth | 9.2 | 4.1e | 2.7 | 3.9 | 4.3 | 4.1 |
| Employment Growth | 4.6 | 2.4 | 0.8 | 1.7 | 1.4 | 1.4 |
| CPI Inflation | 6.8 | 3.8 | 2.6 | 2.0 | 2.0 | 2.0 |
Table footnotes:
e = estimate.
p = Ontario Ministry of Finance planning projection based on external sources as of January 25, 2024.
Sources: Statistics Canada and Ontario Ministry of Finance.
Revisions to the Economic Outlook Since the 2023 Budget
Ontario’s real GDP grew by an estimated 1.2 per cent in 2023, stronger than the projection in the 2023 Budget, and nominal GDP growth is estimated at 4.1 per cent, higher than the 2.8 per cent 2023 Budget projection.
The outlook has been revised compared to the projections in the 2023 Budget. Key changes since the 2023 Budget include the following:
- Stronger estimated real and nominal GDP growth in 2023, accompanied by significantly stronger job creation and a lower unemployment rate;
- Slower real and nominal GDP growth between 2024 and 2026, with the most pronounced deterioration in 2024;
- Weaker net operating surplus of corporations growth over the forecast period; and
- Stronger housing starts throughout the forecast period.
| 2023 2023 Budget |
2023 2024 Budget |
2024p 2023 Budget |
2024p 2024 Budget |
2025p 2023 Budget |
2025p 2024 Budget |
2026p 2023 Budget |
2026p 2024 Budget |
|
|---|---|---|---|---|---|---|---|---|
| Real Gross Domestic Product | 0.2 | 1.2e | 1.3 | 0.3 | 2.5 | 1.9 | 2.4 | 2.2 |
| Nominal Gross Domestic Product | 2.8 | 4.1e | 3.6 | 2.7 | 4.6 | 3.9 | 4.5 | 4.3 |
| Compensation of Employees | 5.1 | 6.7e | 4.2 | 4.3 | 4.5 | 4.4 | 4.2 | 4.1 |
| Net Operating Surplus — Corporations | (8.2) | (12.6)e | (0.5) | (4.7) | 9.2 | 3.5 | 9.1 | 7.9 |
| Nominal Household Consumption | 5.1 | 6.0e | 4.1 | 3.5 | 4.3 | 4.1 | 4.2 | 4.3 |
| Other Economic Indicators — Employment | 0.5 | 2.4 | 1.0 | 0.8 | 1.7 | 1.7 | 1.7 | 1.4 |
| Other Economic Indicators — Job Creation (000s) | 39 | 183 | 78 | 63 | 133 | 136 | 136 | 114 |
| Other Economic Indicators — Unemployment Rate (Per Cent) | 6.4 | 5.7 | 6.6 | 6.7 | 6.3 | 6.6 | 6.3 | 6.4 |
| Other Economic Indicators — Consumer Price Index | 3.6 | 3.8 | 2.1 | 2.6 | 2.0 | 2.0 | 2.0 | 2.0 |
| Other Economic Indicators — Housing Starts (000s)1 | 80.3 | 89.3 | 79.3 | 87.9 | 82.7 | 92.3 | 83.2 | 94.4 |
| Other Economic Indicators — Home Resales | (8.9) | (12.3) | 21.0 | 4.0 | 1.2 | 16.0 | 1.2 | 1.2 |
| Other Economic Indicators — Home Resale Prices | (9.7) | (6.3) | 2.2 | (0.2) | 4.0 | 3.1 | 4.0 | 4.0 |
| Key External Variables — U.S. Real Gross Domestic Product | 0.5 | 2.5 | 1.2 | 2.1 | 2.1 | 1.7 | 2.1 | 2.1 |
| Key External Variables — WTI Crude Oil ($US per Barrel) | 83 | 78 | 80 | 79 | 79 | 78 | 79 | 77 |
| Key External Variables — Canadian Dollar (Cents US) | 74.4 | 74.1 | 76.5 | 74.6 | 77.6 | 77.6 | 78.5 | 78.2 |
| Key External Variables — Three-Month Treasury Bill Rate (Per Cent)2 | 4.3 | 4.8 | 3.3 | 4.4 | 2.5 | 3.0 | 2.4 | 2.6 |
| Key External Variables — 10-Year Government Bond Rate (Per Cent)2 | 3.1 | 3.3 | 3.1 | 3.2 | 3.1 | 3.1 | 3.2 | 3.3 |
Table footnotes:
e = estimate.
p = Ontario Ministry of Finance planning projection based on external sources as of January 25, 2024.
[1] Housing starts projection based on private-sector average as of January 25, 2024.
[2] Government of Canada interest rates.
Sources: Statistics Canada; Canada Mortgage and Housing Corporation; Canadian Real Estate Association; Bank of Canada; United States Bureau of Economic Analysis; Blue Chip Economic Indicators (October 2023 and February 2024); U.S. Energy Information Administration; and Ontario Ministry of Finance.
Managing Ontario’s Finances Responsibly
The government is providing a transparent update on Ontario’s finances and its plan to invest in communities.
The government’s multi-year fiscal plan is consistent with the requirements of the Fiscal Sustainability, Transparency and Accountability Act, 2019 and its governing principles guide Ontario’s fiscal policy.
- Transparent: The government continues to demonstrate its commitment to transparency through the release of regular financial updates. In addition, for the sixth year in a row, the Auditor General of Ontario has provided a clean audit opinion on Ontario’s consolidated financial statements.
- Responsible: The government has developed a measured and responsible approach to managing Ontario’s finances, while investing in key public services and capital projects that will help to improve economic productivity, invest in communities and create jobs.
- Flexible: The government’s plan has built in appropriate levels of prudence in the form of contingency funds and a reserve to ensure that the necessary fiscal flexibility is available to respond to changing circumstances.
- Equitable: The government’s plan strengthens critical public services, such as health care, for people today and to ensure that they are available for future generations.
- Sustainable: The government is committed to employing a flexible approach to respond to ongoing economic uncertainty, while balancing these needs with the long-term sustainability of Ontario’s finances, including the debt burden.
Ontario’s Fiscal Plan
In 2024–25, the government is projecting a deficit of $9.8 billion, improving to a deficit of $4.6 billion in 2025–26 and a surplus of $0.5 billion in 2026–27. This is driven by slower growth impacting revenues, increased compensation costs and increased investments in infrastructure, municipalities and key public services, as well as gas tax relief.
| Actual 2022–23 |
Interim1 2023–24 |
Medium-Term Outlook 2024–25 | Medium-Term Outlook 2025–26 | Medium-Term Outlook 2026–27 | |
|---|---|---|---|---|---|
| Revenue — Personal Income Tax | 44.2 | 50.6 | 51.9 | 55.1 | 58.3 |
| Revenue — Sales Tax | 36.1 | 39.8 | 38.8 | 40.6 | 42.7 |
| Revenue — Corporations Tax | 27.8 | 24.2 | 24.9 | 26.3 | 28.0 |
| Revenue — Ontario Health Premium | 4.4 | 4.9 | 5.0 | 5.2 | 5.4 |
| Revenue — Education Property Tax | 6.0 | 5.8 | 5.8 | 5.9 | 5.9 |
| Revenue — All Other Taxes | 18.0 | 17.2 | 18.2 | 20.4 | 21.0 |
| Total Taxation Revenue | 136.5 | 142.5 | 144.7 | 153.5 | 161.3 |
| Government of Canada | 31.3 | 34.8 | 36.3 | 37.5 | 38.7 |
| Income from Government Business Enterprises | 6.1 | 7.3 | 6.8 | 8.0 | 7.8 |
| Other Non-Tax Revenue | 19.0 | 19.8 | 18.0 | 18.5 | 18.8 |
| Total Revenue | 192.9 | 204.3 | 205.7 | 217.4 | 226.6 |
| Base Programs2 — Health Sector | 75.1 | 84.5 | 85.0 | 88.0 | 89.9 |
| Base Programs2 — Education Sector3 | 33.6 | 36.6 | 37.6 | 38.8 | 39.4 |
| Base Programs2 — Postsecondary Education Sector | 11.7 | 12.6 | 12.2 | 12.5 | 13.0 |
| Base Programs2 — Children, Community and Social Services Sector | 18.0 | 19.4 | 19.9 | 20.1 | 20.1 |
| Base Programs2 — Justice Sector | 5.3 | 6.1 | 5.9 | 5.6 | 5.6 |
| Base Programs2 — Other Programs | 30.1 | 35.3 | 40.0 | 40.9 | 40.9 |
| Total Base Programs | 173.8 | 194.5 | 200.6 | 205.8 | 208.9 |
| Total Base Programs — COVID-19 Time-Limited Funding | 6.3 | – | – | – | – |
| Total Base Programs — Other One-Time Expenses | 6.3 | – | – | – | – |
| Total Programs | 186.4 | 194.5 | 200.6 | 205.8 | 208.9 |
| Interest on Debt | 12.4 | 12.8 | 13.9 | 14.7 | 15.2 |
| Total Expense | 198.8 | 207.3 | 214.5 | 220.6 | 224.1 |
| Surplus/(Deficit) Before Reserve | (5.9) | (3.0) | (8.8) | (3.1) | 2.5 |
| Reserve | – | – | 1.0 | 1.5 | 2.0 |
| Surplus/(Deficit) | (5.9) | (3.0) | (9.8) | (4.6) | 0.5 |
| Net Debt as a Per Cent of GDP | 38.2% | 38.0% | 39.2% | 39.5% | 39.1% |
| Net Debt as a Per Cent of Revenue | 207.6% | 203.0% | 213.5% | 211.4% | 209.4% |
| Interest on Debt as a Per Cent of Revenue | 6.4% | 6.3% | 6.8% | 6.8% | 6.7% |
Table footnotes:
[1] Interim represents the 2024 Budget projection for the 2023–24 fiscal year.
[2] For presentation purposes in the 2024 Budget, one-time COVID-19-related spending in 2022–23 has been included within COVID-19 Time-Limited Funding. This funding is no longer reported separately, starting in 2023–24.
[3] Excludes Teachers’ Pension Plan. Teachers’ Pension Plan expense is included in Other Programs.
Note: Numbers may not add due to rounding.
Sources: Ontario Treasury Board Secretariat and Ontario Ministry of Finance.
Revenue Outlook Over the Medium Term
Ontario’s revenue outlook is forecast to increase from $204.3 billion in 2023–24 to $226.6 billion in 2026–27.
Ontario’s revenue outlook is anchored by an economic projection based on private-sector forecasts and the best available information at the time of finalizing the planning projection. Details of the medium-term revenue outlook are outlined later in this Budget. See Chapter 3: Continuing to Invest in the Plan to Build: Ontario’s Fiscal Plan and Outlook for more details.
Key inputs included in the revenue forecast are a prudent economic outlook; existing federal–provincial agreements and funding formulas; and the business plans of government ministries, business enterprises and service organizations.
Program Expense Outlook Over the Medium Term
Ontario’s program expense outlook is expected to grow from $194.5 billion in 2023–24 to $208.9 billion in 2026–27. The additional funding will primarily be used to strengthen communities through investments in health, education and infrastructure.
Interest on Debt Outlook Over the Medium Term
Interest on debt is forecast to be $12.8 billion in 2023–24, down from the 2023 Budget forecast of $14.1 billion and remains lower than the forecast for each of the medium‑term outlook years in the 2023 Budget.
Other Fiscal Plan Assumptions
The reserve is set at $1.0 billion in 2024–25, $1.5 billion in 2025–26, and $2.0 billion in 2026–27, reflecting Ontario’s commitment to maintaining a prudent and flexible fiscal plan.
The net debt-to-GDP ratio is projected to be 39.2 per cent in 2024–25, 39.5 per cent in 2025–26, and declining to 39.1 per cent in 2026–27.
Economic and Fiscal Outlook Scenarios
In recognition of the elevated degree of economic uncertainty, the Ontario Ministry of Finance has once again developed Faster Growth and Slower Growth scenarios that the economy could take over the next several years. These alternative scenarios should not be considered the best case or the worst case. Rather, they illustrate a broader range of possible alternative outcomes.
| 2024p | 2025p | 2026p | 2027p | |
|---|---|---|---|---|
| Faster Growth Scenario | 1.4 | 2.6 | 2.5 | 2.5 |
| Planning Projection | 0.3 | 1.9 | 2.2 | 2.2 |
| Slower Growth Scenario | (0.6) | 1.4 | 2.1 | 2.1 |
Table footnotes:
p = Ontario Ministry of Finance planning projection based on external sources as of January 25, 2024, and alternative scenarios.
Source: Ontario Ministry of Finance.
| 2024p | 2025p | 2026p | 2027p | |
|---|---|---|---|---|
| Faster Growth Scenario | 4.5 | 4.7 | 4.8 | 4.6 |
| Planning Projection | 2.7 | 3.9 | 4.3 | 4.1 |
| Slower Growth Scenario | 1.1 | 3.3 | 4.0 | 3.8 |
Table footnotes:
p = Ontario Ministry of Finance planning projection based on external sources as of January 25, 2024, and alternative scenarios.
Source: Ontario Ministry of Finance.
In the event that the alternative economic scenarios materialize as opposed to the Planning Projection, Ontario’s fiscal plan would also change as a result. See Chapter 3: Continuing to Invest in the Plan to Build: Ontario’s Fiscal Plan and Outlook, Revenue Outlook Scenarios section for more information.
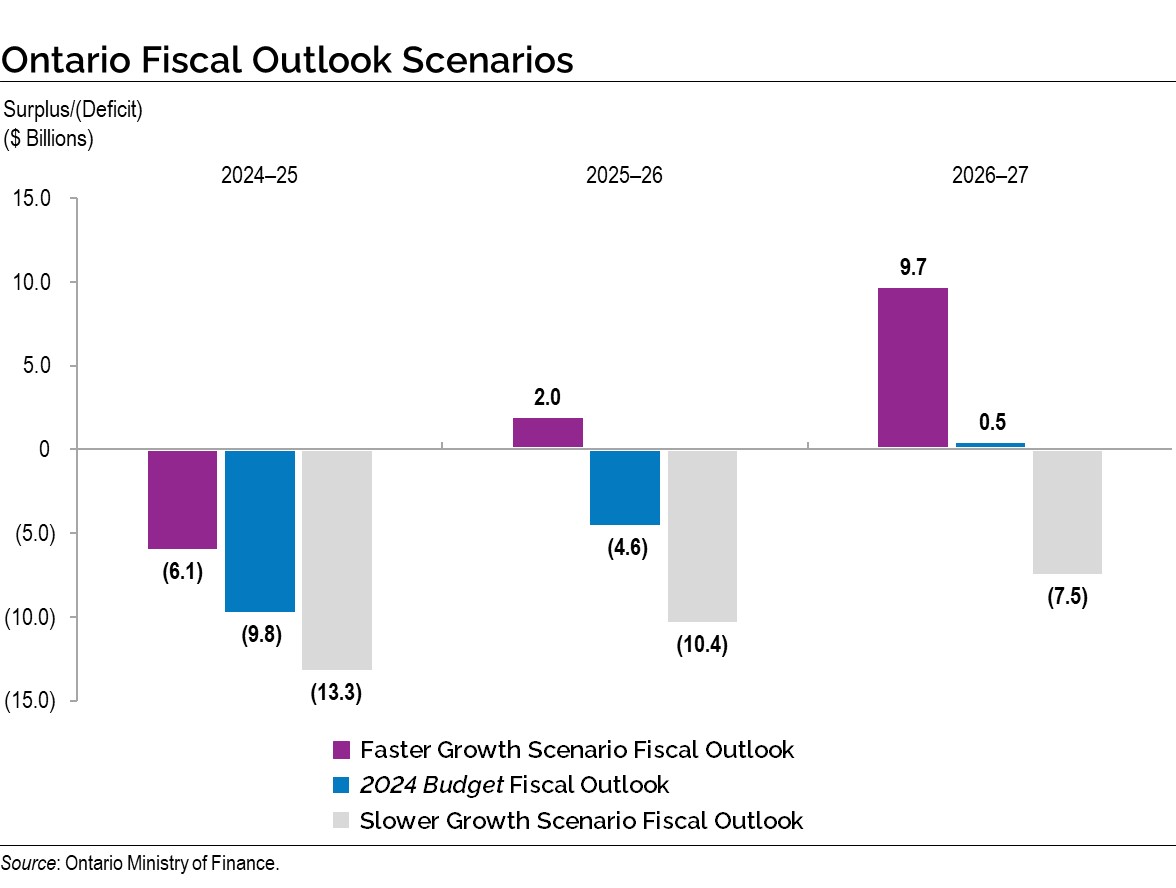
Under the Faster Growth scenario, the deficit outlook may improve to $6.1 billion in 2024–25, followed by surpluses of $2.0 billion in 2025–26 and $9.7 billion in 2026–27. However, if the Slower Growth scenario takes place instead, the deficit outlook may deteriorate to $13.3 billion in 2024–25, $10.4 billion in 2025–26 and $7.5 billion in 2026–27.
Borrowing and Debt Management
Ontario’s borrowing program is primarily used to fund deficits, refinance maturing debt and make investments in capital assets. Ontario will continue to finance most of its borrowing program in the long-term public markets in Canada as well as internationally. Ontario has completed long-term public borrowing of $41.8 billion for 2023–24. The total long-term borrowing requirements for 2024–25, 2025–26 and 2026–27 are forecast to be $38.2 billion, $37.7 billion and $32.8 billion, respectively.
| 2023–24 2023 Budget |
2023–24 Change from 2023 Budget |
Medium-Term Outlook Interim1 2023–24 |
Medium-Term Outlook 2024–25 |
Medium-Term Outlook 2025–26 |
Medium-Term Outlook 2026–27 |
|
|---|---|---|---|---|---|---|
| Deficit/(Surplus) | 1.3 | 1.7 | 3.0 | 9.8 | 4.6 | (0.5) |
| Investment in Capital Assets | 13.6 | 1.2 | 14.7 | 17.7 | 20.2 | 20.4 |
| Non-Cash and Cash Timing Adjustments | (9.2) | 7.6 | (1.6) | (11.0) | (12.0) | (13.9) |
| Net Loans and Investments | 0.1 | (0.4) | (0.2) | (0.3) | 0.1 | – |
| Debt Maturities and Redemptions | 31.2 | – | 31.2 | 28.0 | 33.1 | 26.9 |
| Total Funding Requirement | 37.0 | 10.1 | 47.1 | 44.2 | 46.0 | 32.8 |
| Decrease/(Increase) in Short-Term Borrowing | – | – | – | (5.0) | – | – |
| Increase/(Decrease) in Year-End Cash and Cash Equivalents2 | 5.0 | 4.3 | 9.3 | (1.0) | (8.3) | – |
| Pre-borrowing in 2022–23 for 2023–24 | (14.5) | – | (14.5) | – | – | – |
| Total Long-Term Public Borrowing | 27.5 | 14.3 | 41.8 | 38.2 | 37.7 | 32.8 |
[1] Interim represents the 2024 Budget projection for the 2023–24 fiscal year.
[2] Starting in 2024–25, pre-borrowing will be reflected as part of the increase in year-end cash and cash equivalents.
Note: Numbers may not add due to rounding.
Source: Ontario Financing Authority.
Ontario is forecast to pay $12.8 billion in interest costs in 2023–24, $13.9 billion in 2024–25 and $14.7 billion in 2025–26, down from the 2023 Budget forecasts of $14.1 billion, $14.4 billion and $15.1 billion, respectively. These lower interest costs total a cumulative savings of more than $2 billion over three years and are a result of lower actual and projected cost of borrowing. Interest on debt in 2026–27 is forecast to be $15.2 billion.
The government remains committed to reducing the debt burden and putting Ontario’s finances back on a more sustainable path. The province’s debt sustainability targets are reviewed annually, based on the latest economic and fiscal conditions, to ensure Ontario is making progress towards reducing the debt burden. Meeting these targets on a sustained basis would help improve Ontario’s credit rating profile and lower Ontario’s cost of borrowing. This would result in less money being required to pay for interest on debt, which frees up resources for other priorities. The targets, which remain unchanged from the 2023 Budget, are listed in the table below.
| Targets | 2023 Budget 2023–24 Forecast |
2023 FES 2023–24 Forecast |
2024 Budget 2023–24 Forecast |
2024 Budget 2024–25 Forecast |
|
|---|---|---|---|---|---|
| Net Debt-to-GDP | <40.0 | 37.8 | 38.4 | 38.0 | 39.2 |
| Net Debt-to-Revenue | <200 | 199 | 206 | 203 | 214 |
| Interest on Debt-to-Revenue | <7.5 | 6.9 | 6.7 | 6.3 | 6.8 |
Table footnotes:
Note: 2023 FES is defined as the 2023 Ontario Economic Outlook and Fiscal Review.
Source: Ontario Financing Authority.
See Chapter 4: Borrowing and Debt Management for more details on Ontario’s borrowing program, including borrowing outlook scenarios and the debt burden reduction strategy.
A Capital Plan to Build a Better Ontario
Ontario’s Plan to Build includes the most ambitious capital plan in Ontario’s history, with planned investments over the next 10 years totalling $190.2 billion, including $26.2 billion in 2024–25. To address the historic infrastructure deficit, this plan is getting shovels in the ground to build highways, hospitals and other critical assets, laying the foundation for a better Ontario.
Key highlights in the capital plan include:
Building Highways
$27.4 billion over 10 years to support the planning and construction of highway expansion and rehabilitation projects across the province, including:
- Highway 413, a new 400-series highway and transportation corridor across Halton, Peel and York Regions that will bring relief to one of the busiest corridors in North America and save drivers up to 30 minutes each way on their commute;
- Bradford Bypass, a new four-lane freeway connecting Highway 400 in Simcoe County and Highway 404 in York Region, which will save drivers an estimated 35 minutes in travel time;
- Enabling the expansion of Highway 401 east from Brock Road in Pickering to help relieve gridlock for tens of thousands of drivers per day and get goods moving faster;
- The Queen Elizabeth Way (QEW) Garden City Skyway Bridge Twinning project, which includes construction of a new bridge on the QEW over the Welland Canal connecting the City of St. Catharines to the Town of Niagara‑on‑the‑Lake;
- Widening existing corridors across the province, such as Highway 404 from Highway 407 to Major Mackenzie Drive in Markham, Highway 11/17 between Thunder Bay and Nipigon and Highway 17 between Kenora and the Manitoba border;
- Advancing work to support the new Highway 7 from Kitchener to Guelph, including replacement of the Frederick Street Bridge in Kitchener. Once fully constructed, the new highway will provide relief to the busy Highway 401 and connect the fast‐growing urban centres of Kitchener, Waterloo and Guelph.
- Supporting the construction of a new interchange at Banwell Road and E.C. Row Expressway in the City of Windsor to keep people and goods moving and support development in the area;
- Supporting the planning and design for a new interchange connecting Highway 401 to Lauzon Parkway in Windsor, which will support increased opportunities for trade and better access to the Windsor-Detroit border;
- Widening Highway 3 from two to four lanes between Essex and Leamington to improve road safety and keep people and goods moving in Southwestern Ontario; and
- Supporting the planning and design for a new interchange at Highway 416 and Barnsdale Road in Ottawa to support population growth and development planned by the City for the Barrhaven South area.
Building Transit
$67.5 billion over 10 years for public transit, with a variety of projects underway, including:
- Transforming the GO Transit rail network to improve access and convenience across the Greater Golden Horseshoe by increasing service with two-way, all-day GO trains across the core network with faster trains, more stations and better connections;
- Making investments to extend GO Transit rail service to Bowmanville;
- Extending the Hazel McCallion Light Rail Transit (LRT) by beginning the planning and design activities for the Mississauga loop and extension of the line into downtown Brampton;
- Expanding service on the Milton GO Line by adding train trips and advancing the planning and design work for future two-way, all-day service;
- Continuing to increase frequency of GO train service between Union Station and the Niagara Region, with more express service between Hamilton, Burlington and Toronto. The government continues to see increased ridership with the recently introduced year-round weekend GO rail service between Union Station in Toronto and Niagara Falls;
- Advancing work on the Ontario Line, which will provide rapid transit from Exhibition/Ontario Place to Eglinton Avenue and Don Mills Road as well as connect more than 40 other transit routes, including GO train lines, subway and streetcar lines and the Eglinton Crosstown;
- Continuing tunnelling for the three‐stop Scarborough Subway Extension from Kennedy Station to Sheppard Avenue and McCowan Road and awarding the contract for design and construction of new underground stations with bus terminals; and continuing tunnelling on the Eglinton Crosstown West Extension. As of February 2024, tunnelling is over 80 per cent complete. Contracts were awarded for the elevated guideway portion in December 2023 and the Advance Tunnel 2 project in February 2024;
- Advancing work on the Yonge North Subway Extension by issuing a Request for Proposal (RFP) for the Advance Tunnel Contract that includes work to design, build and finance the construction of the tunnels;
- Funding for construction of station and track improvements to restore the Northlander passenger rail service between Toronto and Northern Ontario. As part of its commitment, the government has purchased three new trainsets for the rail fleet for the reinstated service; and
- Making improvements to stations and the railway corridor to enable two-way, all-day service on the Kitchener Line.
Building Health Infrastructure
Nearly $50 billion over the next 10 years in hospital infrastructure, including close to $36 billion in hospital capital grants, to support more than 50 hospital projects that would add approximately 3,000 new beds over 10 years to increase access to reliable, quality care. Investments are being made to support hospital projects, including:
- Funding to support the Weeneebayko Area Health Authority (WAHA) Redevelopment Project to build a new hospital and Elder Care Lodge in Moosonee, as well as a new ambulatory care centre on Moose Factory Island contingent upon necessary federal investment;
- Support for the construction of a new 17-storey tower at the corner of Queen and Victoria in Toronto at the Unity Health Toronto — St. Michael’s Hospital to accommodate an expanded emergency department, ambulatory services, administrative spaces and off-site dialysis services;
- Funding for the redevelopment of the Ottawa Hospital — Civic Campus to become one of the most advanced trauma centres in Eastern Ontario providing highly specialized emergency and trauma services for treatment of complex injuries and illnesses;
- Support for the new Windsor-Essex Regional Hospital — a new state-of-the-art acute care hospital in Windsor and Essex County;
- Support the redevelopment of the emergency department and fracture clinic at Centenary Hospital, as well as the construction of a new chronic kidney disease facility that will be located in the new Bridletowne Neighbourhood Centre community hub for the Scarborough Health Network to build more capacity for Scarborough and its surrounding communities; and
- Support the renovation of existing space at the Thunder Bay Regional Health Sciences Centre, in partnership with the University Health Network, to deliver high-quality cardiovascular surgery services.
Building Long-Term Care
Planned investments that total a historic $6.4 billion since 2019 to build 58,000 new and upgraded long‐term care beds across the province by 2028 to modern design standards, including:
- Through the Accelerated Build Pilot Program, four new long-term care homes have been built on hospital-owned lands. These homes have created 1,272 new long-term care beds and are helping to meet urgent needs for more long-term care homes in Ajax, Toronto and Mississauga; and
- The government is helping to increase long‐term care capacity in communities across the province by providing loan guarantees to select non‐municipal not‐for‐profit homes.
Building Schools
- Investing over $23 billion, including approximately $16 billion in capital grants over the next 10 years, to build more schools and child care spaces, including a new joint French and English public school in Blind River, a new English public secondary school in Ottawa, an addition to St. Anne’s Catholic Elementary School in St. Thomas and a new French Catholic secondary school in Vaughan.
Building Postsecondary Education Infrastructure
- Investing $6.1 billion in the Postsecondary Education sector over the next 10 years, including over $2.2 billion in capital grants, to help colleges, universities and Indigenous Institutes modernize facilities by upgrading technology, supporting critical repairs and improving energy efficiency.
Building High-Speed Internet
- Investing nearly $4 billion, beginning in 2019–20, to ensure every community across Ontario has access to high-speed internet by the end of 2025. Multiple programs are well underway to provide access to internet service and better cellular connectivity, including launching a Request for Proposal to find a qualified satellite internet service provider, as well as advancing the Southwestern Integrated Fibre Technology and Eastern Ontario Regional Network initiatives.
Building Housing-Enabling Municipal Infrastructure
- Investing $1.8 billion over three years, beginning in 2024–25, to help build municipal housing‑enabling infrastructure projects through the $1.0 billion new Municipal Housing Infrastructure Program and the enhanced $825 million Housing-Enabling Water Systems Fund.
| Sector | Interim2,3 2023–24 |
Medium-Term Outlook 2024–25 |
Medium-Term Outlook 2025–26 |
Medium-Term Outlook 2026–27 |
10-Year Total4 |
|---|---|---|---|---|---|
| Transportation — Transit | 8,638 | 10,695 | 11,982 | 8,509 | 67,466 |
| Transportation — Provincial Highways | 3,285 | 3,872 | 3,922 | 3,411 | 27,418 |
| Transportation — Other Transportation, Property and Planning | 188 | 218 | 229 | 127 | 1,245 |
| Health — Hospitals | 3,348 | 3,582 | 4,658 | 5,861 | 48,568 |
| Health — Other Health | 640 | 303 | 578 | 1,390 | 8,684 |
| Education | 3,316 | 3,350 | 3,173 | 3,025 | 23,095 |
| Postsecondary Education — Colleges and Other | 765 | 879 | 820 | 662 | 4,763 |
| Postsecondary Education — Universities | 113 | 130 | 127 | 136 | 1,297 |
| Social | 435 | 975 | 787 | 527 | 3,376 |
| Justice | 514 | 908 | 707 | 587 | 4,135 |
| Other Sectors5 | 2,874 | 4,307 | 4,550 | 4,368 | 22,704 |
| Total Infrastructure Expenditures | 24,117 | 29,220 | 31,534 | 28,603 | 212,752 |
| Less: Other Partner Funding6 | 3,176 | 2,972 | 1,996 | 1,900 | 22,543 |
| Total7 | 20,941 | 26,248 | 29,538 | 26,703 | 190,209 |
Table footnotes:
[1] Includes interest capitalized during construction; third-party investments in hospitals, colleges and schools; federal and municipal contributions to provincially owned infrastructure investments; and transfers to municipalities, universities and non-consolidated agencies.
[2] Interim represents the 2024 Budget projection for the 2023–24 fiscal year.
[3] Includes provincial investment in capital assets of $14.7 billion.
[4] Total reflects the planned infrastructure expenditures for years 2024–25 through to 2033–34.
[5] Includes high-speed internet infrastructure, government administration, natural resources, and culture and tourism industries.
[6] Other Partner Funding refers to third-party investments primarily in hospitals, colleges and schools.
[7] Includes Federal/Municipal contributions to provincial infrastructure investments.
Note: Numbers may not add due to rounding.
Source: Ontario Treasury Board Secretariat.
Chart Descriptions
Current Fiscal Outlook Compared to the 2023 Budget and 2023 Ontario Economic Outlook and Fiscal Review
The bar chart illustrates the fiscal outlooks presented in the 2023 Budget and the 2023 Ontario Economic Outlook and Fiscal Review compared to the current outlook in the 2024 Budget. The 2023 Budget projected a deficit of $1.3 billion in 2023–24 and surpluses of $0.2 billion in 2024–25 and $4.4 billion in 2025–26. The 2023 Ontario Economic Outlook and Fiscal Review projected deficits of $5.6 billion in 2023–24 and $5.3 billion in 2024–25, and a surplus of $0.5 billion in 2025–26. With the release of the 2024 Budget, the deficit projections have been revised to deficits of $3.0 billion in 2023–24, $9.8 billion in 2024–25 and $4.6 billion in 2025–26, and a surplus of $0.5 billion in 2026–27.
Source: Ontario Ministry of Finance.
Ontario Fiscal Outlook Scenarios
The bar chart illustrates the range of Ontario fiscal outlooks based on the two alternative economic scenarios presented in Chapter 2: Economic Performance and Outlook. The 2024 Budget outlook estimates the deficit to be $9.8 billion in 2024–25 and $4.6 billion in 2025–26, followed by a surplus of $0.5 billion in 2026–27. Under the Faster Growth scenario, the deficit outlook is estimated to be $6.1 billion in 2024–25, followed by surpluses of $2.0 billion in 2025–26 and $9.7 billion in 2026–27. Under the Slower Growth scenario, the deficit outlook is estimated to be $13.3 billion in 2024–25, $10.4 billion in 2025–26 and $7.5 billion in 2026–27.
Source: Ontario Ministry of Finance.