Ontario’s Economic and Fiscal Outlook in Brief
In just the last five years, Ontario’s economy has navigated the COVID-19 pandemic, a worldwide supply chain disruption, a global surge in inflation, decades high population growth, and the fastest rise in interest rates in recent Canadian history. Ontario’s economy has shown resilience despite these economic and geopolitical uncertainties; however, Ontario now faces one of its greatest challenges. The tariffs imposed by the United States are a significant risk to Ontario’s economy and are already impacting people and businesses on both sides of the border.
In the face of these challenges, the government is ready to respond to protect Ontario workers, businesses and families. The government continues to make progress on its plan to build Ontario, with a stronger, more competitive and resilient economy, while also taking a responsible approach to fiscal management.
Ontario’s economy continued to grow and add jobs in 2024 as inflationary pressures eased throughout the year. In addition, real gross domestic product (GDP) increased by 1.5 per cent and employment rose by 140,000. Although there were solid gains in 2024, tariff-related uncertainty is already creating instability in financial markets and the economy, which is expected to have an impact across the projection period.
In 2024–25, Ontario is projecting a deficit of $6.0 billion. Over the medium term, the government is projecting deficits of $14.6 billion in 2025–26 and $7.8 billion in 2026–27, before returning to a surplus of $0.2 billion in 2027–28.
The government will use every tool at its disposal to protect Ontario and respond to the changing economic environment.
Ontario’s Economic Outlook
Ontario’s real GDP is projected to rise to 0.8 per cent in 2025, then increase by 1.0 per cent in 2026 and by 1.9 per cent in both 2027 and 2028. Real GDP forecasts are lower over the projection period compared to the 2024 Budget, largely due to the impacts of U.S. trade policies and related uncertainty. For the purposes of prudent fiscal planning, these projections are set slightly below the average of private‐sector forecasts.
| Item | 2024 | 2025p | 2026p | 2027p | 2028p |
|---|---|---|---|---|---|
| Real GDP Growth | 1.5 | 0.8 | 1.0 | 1.9 | 1.9 |
| Nominal GDP Growth | 5.2 | 3.1 | 3.0 | 4.0 | 4.0 |
| Employment Growth | 1.7 | 0.9 | 0.4 | 0.9 | 0.9 |
| CPI Inflation | 2.4 | 2.3 | 2.0 | 2.0 | 2.0 |
Table footnotes:
p = Ontario Ministry of Finance planning projection based on external sources as of April 3, 2025.
Sources: Statistics Canada and Ontario Ministry of Finance.
Revisions to the Economic Outlook Since the 2024 Budget
The outlook has been revised compared to the projections in the 2024 Budget. Key changes since the 2024 Budget include the following:
- Much stronger real and nominal GDP growth in 2024, alongside robust job creation;
- Slower real and nominal GDP growth over the forecast period, with weaker job market performance; and
- Stronger compensation of employees growth in 2024, but weaker for the remainder of the projection period.
| Item | 2024: 2024 Budget |
2024: 2025 Budget |
2025p: 2024 Budget |
2025p: 2025 Budget |
2026p: 2024 Budget |
2026p: 2025 Budget |
2027p: 2024 Budget |
2027p: 2025 Budget |
|---|---|---|---|---|---|---|---|---|
| Real Gross Domestic Product | 0.3 | 1.5 | 1.9 | 0.8 | 2.2 | 1.0 | 2.2 | 1.9 |
| Nominal Gross Domestic Product | 2.7 | 5.2 | 3.9 | 3.1 | 4.3 | 3.0 | 4.1 | 4.0 |
| Compensation of Employees | 4.3 | 5.7 | 4.4 | 3.7 | 4.1 | 3.2 | 4.1 | 3.6 |
| Net Operating Surplus — Corporations | (4.7) | (2.0) | 3.5 | (3.0) | 7.9 | 6.4 | 6.0 | 7.2 |
| Nominal Household Consumption | 3.5 | 4.9 | 4.1 | 3.5 | 4.3 | 3.1 | 4.2 | 3.7 |
| Other Economic Indicators — Employment | 0.8 | 1.7 | 1.7 | 0.9 | 1.4 | 0.4 | 1.4 | 0.9 |
| Other Economic Indicators — Job Creation (000s) | 63 | 140 | 136 | 73 | 114 | 33 | 115 | 74 |
| Other Economic Indicators — Unemployment Rate (Per Cent) | 6.7 | 7.0 | 6.6 | 7.6 | 6.4 | 7.3 | 6.2 | 6.6 |
| Other Economic Indicators — Consumer Price Index | 2.6 | 2.4 | 2.0 | 2.3 | 2.0 | 2.0 | 2.0 | 2.0 |
| Other Economic Indicators — Housing Starts (000s)1 | 87.9 | 74.6 | 92.3 | 71.8 | 94.4 | 74.8 | 95.8 | 82.5 |
| Other Economic Indicators — Home Resales | 4.0 | 3.0 | 16.0 | 5.3 | 1.2 | 12.7 | 1.2 | 4.6 |
| Other Economic Indicators — Home Resale Prices | (0.2) | (0.4) | 3.1 | (1.2) | 4.0 | 2.6 | 4.0 | 3.8 |
| Key External Variables — U.S. Real Gross Domestic Product | 2.1 | 2.8 | 1.7 | 1.4 | 2.1 | 1.4 | 1.9 | 2.0 |
| Key External Variables — WTI Crude Oil ($US per Barrel) | 79 | 77 | 78 | 69 | 77 | 69 | 78 | 74 |
| Key External Variables — Canadian Dollar (Cents US) | 74.6 | 73.0 | 77.6 | 69.2 | 78.2 | 71.2 | 77.0 | 73.0 |
| Key External Variables — Three-Month Treasury Bill Rate (Per Cent)2 | 4.4 | 4.3 | 3.0 | 2.4 | 2.6 | 2.3 | 2.6 | 2.4 |
| Key External Variables — 10-Year Government Bond Rate (Per Cent)3 | 3.2 | 3.4 | 3.1 | 3.1 | 3.3 | 3.2 | 3.5 | 3.4 |
Table footnotes:
p = Ontario Ministry of Finance planning projection based on external sources as of April 3, 2025.
[1] Housing starts projection based on private-sector average as of April 3, 2025.
[2], [3] Government of Canada interest rates.
Sources: Statistics Canada; Canada Mortgage and Housing Corporation; Canadian Real Estate Association; Bank of Canada; United States Bureau of Economic Analysis; Blue Chip Economic Indicators (March and April 2025); U.S. Energy Information Administration; and Ontario Ministry of Finance.
A Strong Foundation for the Next Generation
The government is providing the people of Ontario with a clear view into the province’s finances, outlining its strategy to build a strong and resilient province, now and into the future.
The government’s plan is consistent with the Fiscal Sustainability, Transparency and Accountability Act, 2019 and its governing principles that guide Ontario’s fiscal policy.
- Transparent: The government continues to be transparent through the release of regular fiscal updates. For the seventh year in a row, the Auditor General of Ontario has provided a clean audit opinion on the government’s consolidated financial statements.
- Responsible: The government has taken a measured and accountable approach to managing Ontario’s finances, while investing in key public services and capital projects.
- Flexible: The government’s plan has built in appropriate levels of prudence in the form of contingency funds and a reserve to ensure that the necessary fiscal flexibility is available to respond to changing circumstances.
- Equitable: The government’s plan strengthens and invests in critical public services, such as health care and education, ensuring that these services are readily available for the people of today and maintained for the benefit of future generations.
- Sustainable: The government will continue to respond to ongoing economic uncertainty, while ensuring the long-term sustainability of Ontario’s finances and debt burden.
Ontario’s finances are in the strongest position they have been in over a decade. This fiscal plan includes near-record-low net interest-to-operating revenue anticipated from 2024–25 to 2027–28, and program expenditures as a share of GDP well below the pandemic peak. The 2025 Budget also keeps both the net debt-to-GDP and net debt-to-operating revenue ratios at some of the lowest rates seen since the early 2010s.
Reflecting these improvements, Ontario received two credit rating upgrades in 2024. Morningstar DBRS upgraded Ontario’s rating to AA from AA (low) on June 6, 2024, and S&P raised its credit rating to AA− from A+ on December 3, 2024. This reverses the trend of credit downgrades and shows that Ontario’s prudent and responsible fiscal plan is working. This will help lower Ontario’s borrowing costs and support more investment in the province, creating more jobs, and financing the government’s historic infrastructure plan.
Ontario’s Fiscal Plan
In 2025–26, the government is projecting a deficit of $14.6 billion, improving to a deficit of $7.8 billion in 2026–27 and a surplus of $0.2 billion in 2027–28. This is driven by increased investments to support affordability, critical public services such as health care, education and infrastructure, and a package of measures to protect and support Ontario’s economy in response to U.S. tariffs. Ontario’s revenue projections have also been revised lower than in the 2024 Ontario Economic Outlook and Fiscal Review, in part because of a weaker tariff-induced economic outlook.
| Item | Actual 2023–24 |
Interim2 2024–25 |
Medium-Term Outlook 2025–26 |
Medium-Term Outlook 2026–27 |
Medium-Term Outlook 2027–28 |
|---|---|---|---|---|---|
| Revenue — Personal Income Tax | 50.8 | 56.3 | 57.8 | 61.3 | 65.2 |
| Revenue — Sales Tax | 39.9 | 39.4 | 40.1 | 41.6 | 43.6 |
| Revenue — Corporations Tax | 23.1 | 27.9 | 26.0 | 27.7 | 29.4 |
| Revenue — Ontario Health Premium | 5.0 | 5.2 | 5.4 | 5.6 | 5.8 |
| Revenue — Education Property Tax | 5.8 | 5.8 | 5.9 | 5.9 | 5.9 |
| Revenue — All Other Taxes | 17.3 | 18.1 | 18.6 | 19.2 | 19.8 |
| Total Taxation Revenue | 141.9 | 152.8 | 153.7 | 161.3 | 169.8 |
| Government of Canada | 34.3 | 36.4 | 38.8 | 39.3 | 39.8 |
| Income from Government Business Enterprises | 7.4 | 7.4 | 6.3 | 6.9 | 7.7 |
| Other Non-Tax Revenue | 25.4 | 25.0 | 21.0 | 20.3 | 20.6 |
| Total Revenue | 209.0 | 221.6 | 219.9 | 227.9 | 237.9 |
| Base Programs — Health Sector | 85.2 | 89.3 | 91.1 | 92.4 | 93.6 |
| Base Programs — Education Sector3 | 37.1 | 38.4 | 41.0 | 41.1 | 41.3 |
| Base Programs — Postsecondary Education Sector | 13.3 | 14.2 | 13.0 | 13.1 | 12.8 |
| Base Programs — Children, Community and Social Services Sector | 19.3 | 20.6 | 20.4 | 20.4 | 20.4 |
| Base Programs — Justice Sector | 6.0 | 6.5 | 6.7 | 6.5 | 6.4 |
| Base Programs — Other Programs | 34.4 | 40.6 | 44.1 | 43.1 | 43.3 |
| Total Base Programs | 195.2 | 209.7 | 216.3 | 216.7 | 217.9 |
| Significant Exceptional Expenses | – | 2.7 | – | – | – |
| Total Programs | 195.2 | 212.4 | 216.3 | 216.7 | 217.9 |
| Interest and Other Debt Servicing Charges | 14.5 | 15.2 | 16.2 | 17.0 | 17.8 |
| Total Expense | 209.7 | 227.6 | 232.5 | 233.7 | 235.7 |
| Surplus/(Deficit) Before Reserve | (0.6) | (6.0) | (12.6) | (5.8) | 2.2 |
| Reserve | – | – | 2.0 | 2.0 | 2.0 |
| Surplus/(Deficit) | (0.6) | (6.0) | (14.6) | (7.8) | 0.2 |
| Net Debt as a Per Cent of GDP | 36.4% | 36.3% | 37.9% | 38.9% | 38.6% |
| Net Debt as a Per Cent of Operating Revenue | 198.1% | 195.4% | 211.4% | 215.4% | 212.4% |
| Net Interest as a Per Cent of Operating Revenue | 5.5% | 5.8% | 6.5% | 6.7% | 6.8% |
Table footnotes:
[1] Beginning in the 2025 Budget, the Total Revenue, Interest and Other Debt Servicing Charges (IOD), and Total Expense figures for all years have been restated to report interest and investment income as part of revenue and separate from IOD. These changes are fiscally neutral.
[2] Interim represents the 2025 Budget projection for the 2024–25 fiscal year.
[3] Excludes Teachers’ Pension Plan. Teachers’ Pension Plan expense is included in Other Programs.
Note: Numbers may not add due to rounding.
Sources: Ontario Treasury Board Secretariat and Ontario Ministry of Finance.
Revenue Outlook Over the Medium Term
Ontario’s revenue outlook is forecasted to increase from $209.0 billion in 2023–24 to $237.9 billion in 2027–28.
Ontario’s revenue outlook is anchored by an economic projection based on private-sector forecasts and the best available information at the time of finalizing the planning projection. Details of the medium-term revenue outlook are outlined in Chapter 3: Ontario’s Fiscal Plan and Outlook.
Key inputs included in the revenue forecast are a prudent economic outlook; existing federal–provincial agreements and funding formulas; and the business plans of government ministries, business enterprises and service organizations.
Program Expense Outlook Over the Medium Term
Ontario’s program expense outlook is expected to grow from $195.2 billion in 2023–24 to $217.9 billion in 2027–28. The additional funding will primarily be used to protect Ontario’s economy and its workers and to strengthen communities through investments in critical public services.
Interest and Other Debt Servicing Charges Outlook Over the Medium Term
To increase fiscal transparency, Interest on Debt is being renamed Interest and Other Debt Servicing Charges (IOD) to more accurately reflect the expenses incurred to deliver an effective, cost-efficient borrowing program.
Interest and other debt servicing charges is forecast to be $15.2 billion in 2024–25, down from the 2024 Budget forecast of $16.5 billion, and remains at the same level or lower than the forecast for each of the medium-term outlook years in the 2024 Budget.
Other Fiscal Plan Assumptions
The reserve is set at $2.0 billion each year from 2025–26 to 2027–28, reflecting Ontario’s commitment to maintaining a prudent and flexible fiscal plan. These represent some of the highest reserves allocated in any Ontario Budget.
The net debt-to-GDP ratio is projected to be 37.9 per cent in 2025–26, 38.9 per cent in 2026–27, and 38.6 per cent in 2027–28.
Economic and Fiscal Outlook Scenarios
Due to heightened uncertainty around U.S. trade policies, the Ministry of Finance has developed scenarios to assess the potential impact from tariffs on Ontario’s economy over the projection period. As significant risks remain regarding the scale, scope and timing of U.S. trade policies, these alternative scenarios should not be considered the best case or the worst case. Rather, they illustrate a broader range of possible alternative outcomes. See Chapter 2: Economic Performance and Outlook for more details.
| Item | 2025p | 2026p | 2027p | 2028p |
|---|---|---|---|---|
| Faster Growth Scenario | 1.6 | 1.8 | 2.0 | 2.0 |
| Planning Projection | 0.8 | 1.0 | 1.9 | 1.9 |
| Slower Growth Scenario | 0.0 | (0.4) | 1.9 | 1.9 |
Table footnotes:
p = Ontario Ministry of Finance planning projection based on external sources and alternative scenarios as of April 3, 2025.
Source: Ontario Ministry of Finance.
| Item | 2025p | 2026p | 2027p | 2028p |
|---|---|---|---|---|
| Faster Growth Scenario | 3.8 | 3.9 | 4.0 | 3.9 |
| Planning Projection | 3.1 | 3.0 | 4.0 | 4.0 |
| Slower Growth Scenario | 2.3 | 1.6 | 4.0 | 4.0 |
Table footnotes:
p = Ontario Ministry of Finance planning projection based on external sources and alternative scenarios as of April 3, 2025.
Source: Ontario Ministry of Finance.
In the event that the alternative economic scenarios materialize as opposed to the Planning Projection, Ontario’s fiscal plan would also change as a result.
Based on the two alternative nominal GDP growth economic scenarios, two taxation revenue outlook scenarios were developed.
| Item | 2025–26p | 2026–27p | 2027–28p |
|---|---|---|---|
| Faster Growth Scenario | 156.0 | 166.3 | 176.4 |
| Planning Projection | 153.7 | 161.3 | 169.8 |
| Slower Growth Scenario | 151.3 | 155.4 | 162.3 |
Table footnotes:
p = Ontario Ministry of Finance planning projection based on external sources and alternative scenarios as of April 3, 2025.
Note: Numbers may not add due to rounding.
Source: Ontario Ministry of Finance.
In the Faster Growth scenario, total taxation revenue over the medium term is $6.6 billion higher than the Planning Projection in 2027–28, while in the Slower Growth scenario, total taxation revenue is $7.4 billion lower.
Under the Faster Growth scenario, the deficit outlook may improve to $12.3 billion in 2025–26, $2.5 billion in 2026–27, followed by a surplus of $7.3 billion in 2027–28. However, if the Slower Growth scenario takes place instead, the deficit outlook may deteriorate to $17.1 billion in 2025–26, $13.9 billion in 2026–27 and $7.7 billion in 2027–28.
Borrowing and Debt Management
Ontario’s borrowing program is primarily used to fund deficits, refinance maturing debt and make investments in capital assets. Ontario will continue to finance most of its borrowing program in the long-term public markets in Canada and internationally. Ontario completed long‑term public borrowing of $49.5 billion in 2024–25. The total long-term borrowing requirements for 2025–26, 2026–27 and 2027–28 are forecast to be $42.8 billion, $41.1 billion and $33.0 billion, respectively.
| Item | 2024–25: 2024 Budget | 2024–25: Change from 2024 Budget | 2024–25: Interim1 2024–25 |
Medium-Term Outlook 2025–26 |
Medium-Term Outlook 2026–27 |
Medium-Term Outlook 2027–28 |
|---|---|---|---|---|---|---|
| Deficit/(Surplus) | 9.8 | (3.8) | 6.0 | 14.6 | 7.8 | (0.2) |
| Provincial Investment in Capital Assets | 17.7 | (0.5) | 17.2 | 23.1 | 23.7 | 20.1 |
| Amortization of Capital Assets2 | (8.4) | (0.2) | (8.6) | (9.1) | (9.3) | (10.1) |
| Non-Cash and Cash Timing Adjustments | (2.6) | 6.2 | 3.6 | (3.1) | (3.4) | (4.3) |
| Net Loans and Investments | (0.3) | 0.8 | 0.5 | 1.2 | (0.1) | – |
| Debt Maturities and Redemptions | 28.0 | – | 28.0 | 33.1 | 26.9 | 27.5 |
| Total Funding Requirement | 44.2 | 2.5 | 46.7 | 59.8 | 45.6 | 33.0 |
| Decrease/(Increase) in Short-Term Borrowing | (5.0) | – | (5.0) | (5.0) | (2.5) | – |
| Increase/(Decrease) in Year-End Cash and Cash Equivalents3 | (1.0) | 8.8 | 7.8 | (12.0) | (2.0) | – |
| Total Long-Term Public Borrowing | 38.2 | 11.3 | 49.5 | 42.8 | 41.1 | 33.0 |
Table footnotes:
[1] Interim represents the 2025 Budget projection for the 2024–25 fiscal year.
[2] Starting in the 2025 Budget, Amortization of Capital Assets will be reflected in a separate line in this table to reflect the increasing impact of the capital plan on the borrowing program.
[3] Starting in 2024–25, pre-borrowing will be reflected as part of the increase in year-end cash and cash equivalents.
Note: Numbers may not add due to rounding.
Source: Ontario Financing Authority.
Ontario is forecasted to pay $15.2 billion in interest costs in 2024–25, $16.2 billion in 2025–26 and $17.0 billion in 2026–27. As outlined in the 2024 Ontario Economic Outlook and Fiscal Review, Ontario is updating the presentation of interest costs to improve transparency in financial reporting. Interest costs and interest revenue will now be presented separately — this change is fiscally neutral.
The government remains committed to reducing the debt burden and putting Ontario’s finances back on a more sustainable path. The province’s debt sustainability targets are reviewed annually, based on the latest economic and fiscal conditions, to ensure Ontario is making progress towards reducing the debt burden. Meeting these targets on a sustained basis would help improve Ontario’s credit rating profile and lower its cost of borrowing. This would result in less money being required to pay for interest and other debt servicing charges, which frees up resources for other priorities.
As a result of the change in presentation of interest costs, two of Ontario’s debt sustainability measures will be renamed. “Interest on Debt-to-Revenue” is now “Net Interest-to-Operating Revenue,” and “Net Debt-to-Revenue” is now “Net Debt-to-Operating Revenue.”
The targets, which remain unchanged from the 2023 Budget, are listed in the table below.
| Item | Targets | 2024 Budget 2024–25 Forecast |
2025 Budget 2024–25 Forecast |
2024 Budget 2025–26 Forecast |
2025 Budget 2025–26 Forecast |
|---|---|---|---|---|---|
| Net Debt-to-GDP | <40.0 | 39.2 | 36.3 | 39.5 | 37.9 |
| Net Debt-to-Operating Revenue | <200 | 214 | 195 | 211 | 211 |
| Net Interest-to-Operating Revenue | <7.5 | 6.8 | 5.8 | 6.8 | 6.5 |
Table footnotes:
Source: Ontario Financing Authority.
See Chapter 4: Borrowing and Debt Management for more details on Ontario’s borrowing program, including borrowing outlook scenarios and the debt burden reduction strategy.
A Capital Plan for a Stronger Ontario
Ontario’s Plan to Build includes the most ambitious capital plan in Ontario’s history, with planned investments over the next 10 years totalling over $200 billion, including over $33 billion in 2025–26. To address the historic infrastructure deficit, this plan is getting shovels in the ground to build highways, hospitals and other critical assets, laying the foundation for a stronger Ontario.
Key highlights in the capital plan include:
Building Highways
Nearly $30 billion over 10 years to support the planning and construction of highway expansion and rehabilitation projects across the province, including:
- Highway 413, a new 400‐series highway and transportation corridor across Halton, Peel and York Regions that will bring relief to one of the busiest corridors in North America and save drivers up to 30 minutes each way on their commute;
- Bradford Bypass, a new four‐lane freeway connecting Highway 400 in Simcoe County and Highway 404 in York Region, which will save drivers an estimated 35 minutes in travel time;
- Feasibility work for a Highway 401 tunnel expressway to help relieve gridlock and improve the effectiveness of infrastructure;
- The Queen Elizabeth Way (QEW) Garden City Skyway Bridge Twinning project, which includes construction of a new bridge on the QEW over the Welland Canal, connecting the City of St. Catharines to the Town of Niagara‐on‐the‐Lake;
- Enhancing Highway 401 to improve safety, traffic flow, and support economic development through resurfacing, bridge repairs and ramp upgrades near Kingston and between Mallorytown and Brockville;
- Widening existing corridors across the province, such as Highway 11/17 between Thunder Bay and Nipigon, and Highway 17 between Kenora and the Manitoba border;
- Supporting the planning and design for a new interchange connecting Highway 401 to Lauzon Parkway in Windsor, which will support increased opportunities for trade and better access to the Windsor–Detroit border;
- Continuing progress on uploads of the Gardiner Expressway and Don Valley Parkway, including providing funding that has sped up the repair of the Gardiner Expressway, accelerating the third stage of Section 2 rehabilitation works more than a year ahead of schedule;
- Widening Highway 3 from two to four lanes between Essex and Leamington to improve road safety and keep people and goods moving in Southwestern Ontario; and
- Supporting renewed partnerships with Animbiigoo Zaagi’igan Anishinaabek, Aroland First Nation, Ginoogaming First Nation and Long Lake #58 First Nation to build and improve highway infrastructure that will help connect more First Nation communities to the province’s highway network.
Building Transit
Approximately $61 billion over 10 years for public transit, with a variety of projects underway, including:
- Building the largest subway expansion in Canadian history: the Ontario Line, the Scarborough Subway Extension, the Eglinton Crosstown West Extension and the Yonge North Subway Extension — part of the government’s plan to slash commute times across the Greater Toronto Area (GTA);
- Building and expanding Light Rail Transit (LRT): the Hamilton LRT, Hazel McCallion Line, Eglinton Crosstown and Finch West LRT will provide more people with fast, affordable and reliable transit;
- Investing $758 million to help the Toronto Transit Commission (TTC) purchase 55 new trains for Toronto’s Line 2 subway;
- Advancing feasibility studies for GO 2.0, to build on existing investments in the GO Transit Network with a transformational expansion of GO train service;
- Investing $850 million to refurbish GO Transit rail cars as part of the ongoing service expansion across the GO rail network and to support hundreds of manufacturing jobs and economic growth in Northern Ontario;
- Investing in reinstating the Northlander, which will provide safe and reliable transportation options between Northern Ontario and Toronto. The government is investing in platform reconstruction and installation of pre-manufactured shelters at specific stops, in addition to providing the rail service with new fully accessible and state-of-the-art trains; and
- Constructing the East Harbour Transit Hub, which will improve access to transit for thousands of residents and support more than 50,000 jobs in the area.
Building Health Infrastructure
Approximately $56 billion over the next 10 years in health infrastructure, including over $43 billion in capital grants, to support more than 50 major hospital projects that would add approximately 3,000 new beds over 10 years to increase access to quality care. Investments are being made to support hospital projects, including:
- Funding for the planning of the new Campbellford Memorial Hospital to replace the current hospital and create a “rural hub” with various community support services and additional inpatient beds;
- Funding for the planning of the new Orillia Soldiers’ Memorial Hospital to plan the construction of new hospital facilities to address aging infrastructure and support future growth;
- Investing in renovating and expanding the existing Timmins and District Hospital emergency department to almost four times its current size, with additional acute treatment areas and an area for emergency mental health care. Once complete, the new space will address growth in emergency department volumes and incorporate modern standards and best practices for improving the health of Northern communities;
- Investing in the William Osler Health System – Peel Memorial Hospital to support the March 2025 start of construction for a new multi-storey patient tower with up to 250 inpatient beds and a new, state-of-the-art, 24/7 emergency care centre to connect more people to a wide range of emergency and urgent medical care;
- Advancing the Weeneebayko Area Health Authority project, including support for early works in August 2024. Construction is expected to be complete by 2030 for a state-of-the-art hospital and Elder Care Lodge in Moosonee, along with a new ambulatory care centre on Moose Factory Island, bringing much-needed health services to the region;
- Supporting the North York General Hospital – Inpatient Redevelopment Project for the construction of a new patient tower to address high acuity programs and services, renovations to the hospital’s existing facilities to address infrastructure deficiencies and connectivity between buildings, and the conversion of the existing emergency department into an urgent care centre;
- Funding for the Runnymede Healthcare Centre Post-Traumatic Stress Injury Centre of Excellence, a two-facility project to expand access to comprehensive mental health and rehabilitation treatment for first responders affected by work-related stress or trauma; and
- Funding for the University Health Network’s West Park Reactivation Care Centre to transform the former West Park Healthcare Centre hospital building into a 188-bed reactivation care centre.
Building Long-Term Care
Planned investments that total a historic $6.4 billion since 2019 are in place to build 58,000 new and upgraded long‐term care beds across the province by 2028 to modern design standards. As of April 2025, 23,977 beds (147 projects) are either opened, under construction, or have the approval to start construction, including:
- Advancing construction on 103 long-term care projects that started between April 2022 and April 2025, by providing a supplemental increase to the Construction Funding Subsidy, to stimulate the start of construction for more long-term care homes across Ontario; and
- Introducing new tools to the long-term care sector to support financing the development of long-term care beds with the support of the Building Ontario Fund.
Building Schools
- Investing over $30 billion, including approximately $23 billion in capital grants, over the next 10 years to build more schools and child care spaces, including a new French Catholic elementary school in Sudbury, an addition to Northwood Public Elementary School in Windsor, a new French Catholic elementary school in Ottawa, a new elementary and secondary school in Newcastle, a new English public secondary school in Oshawa, and a new Stouffville public elementary school.
Building Postsecondary Education Infrastructure
- Investing more than $5 billion in the Postsecondary Education sector over the next 10 years, including over $2 billion in capital grants, to help colleges, universities and Indigenous Institutes modernize facilities by upgrading technology, supporting critical repairs and improving energy efficiency.
Building High-Speed Internet
- Investing nearly $4 billion, beginning in 2019–20, to ensure every community across Ontario has access to high-speed internet. As of April 2025, more than 120,000 previously unserved and underserved homes and businesses now have access to high‐speed internet through the broadband programs.
Building Housing-Enabling Municipal Infrastructure
- Investing $2.3 billion over four years, beginning in 2024–25, to help build municipal housing‑enabling infrastructure projects through the Municipal Housing Infrastructure Program (MHIP) and the Housing-Enabling Water Systems Fund (HEWSF). This includes an additional $400 million to address the high demand of HEWSF and MHIP and existing investments through the various streams and intakes that are underway.
| Sector | Interim2, 3 2024–25 |
Medium-Term Outlook 2025–26 |
Medium-Term Outlook 2026–27 |
Medium-Term Outlook 2027–28 |
10-Year Total4 |
|---|---|---|---|---|---|
| Transportation — Transit | 10,100 | 10,749 | 11,282 | 8,136 | 60,665 |
| Transportation — Provincial Highways | 3,387 | 4,259 | 4,125 | 3,741 | 29,881 |
| Transportation — Other Transportation, Property and Planning | 233 | 321 | 178 | 173 | 1,401 |
| Health — Hospitals | 3,546 | 4,470 | 6,600 | 7,775 | 54,127 |
| Health — Other Health | 575 | 732 | 1,001 | 754 | 6,977 |
| Education | 3,865 | 4,216 | 3,393 | 3,011 | 30,057 |
| Postsecondary Education — Colleges and Other | 930 | 708 | 507 | 392 | 3,617 |
| Postsecondary Education — Universities | 136 | 185 | 147 | 206 | 1,445 |
| Social | 750 | 644 | 659 | 490 | 2,403 |
| Justice | 711 | 973 | 823 | 829 | 4,265 |
| Other Sectors5 | 3,624 | 7,778 | 4,770 | 3,491 | 28,247 |
| Total Infrastructure Expenditures | 27,856 | 35,037 | 33,485 | 28,999 | 223,085 |
| Less: Other Partner Funding6 | 3,451 | 1,690 | 1,897 | 2,774 | 22,191 |
| Total7 | 24,405 | 33,346 | 31,588 | 26,225 | 200,894 |
Table footnotes:
[1] Includes interest capitalized during construction; third-party investments in hospitals, colleges and schools; federal and municipal contributions to provincially owned infrastructure investments; and transfers to municipalities, universities and non-consolidated agencies.
[2] Interim represents the 2025 Budget projection for the 2024–25 fiscal year.
[3] Includes provincial investment in capital assets of $17.2 billion.
[4] Total reflects the planned infrastructure expenditures for years 2025–26 through to 2034–35.
[5] Includes high-speed internet infrastructure, government administration, natural resources, and culture and tourism industries.
[6] Other Partner Funding refers to third-party investments, primarily in hospitals, colleges and schools.
[7] Includes federal/municipal contributions to provincial infrastructure investments.
Note: Numbers may not add due to rounding.
Source: Ontario Treasury Board Secretariat.
Chart Descriptions
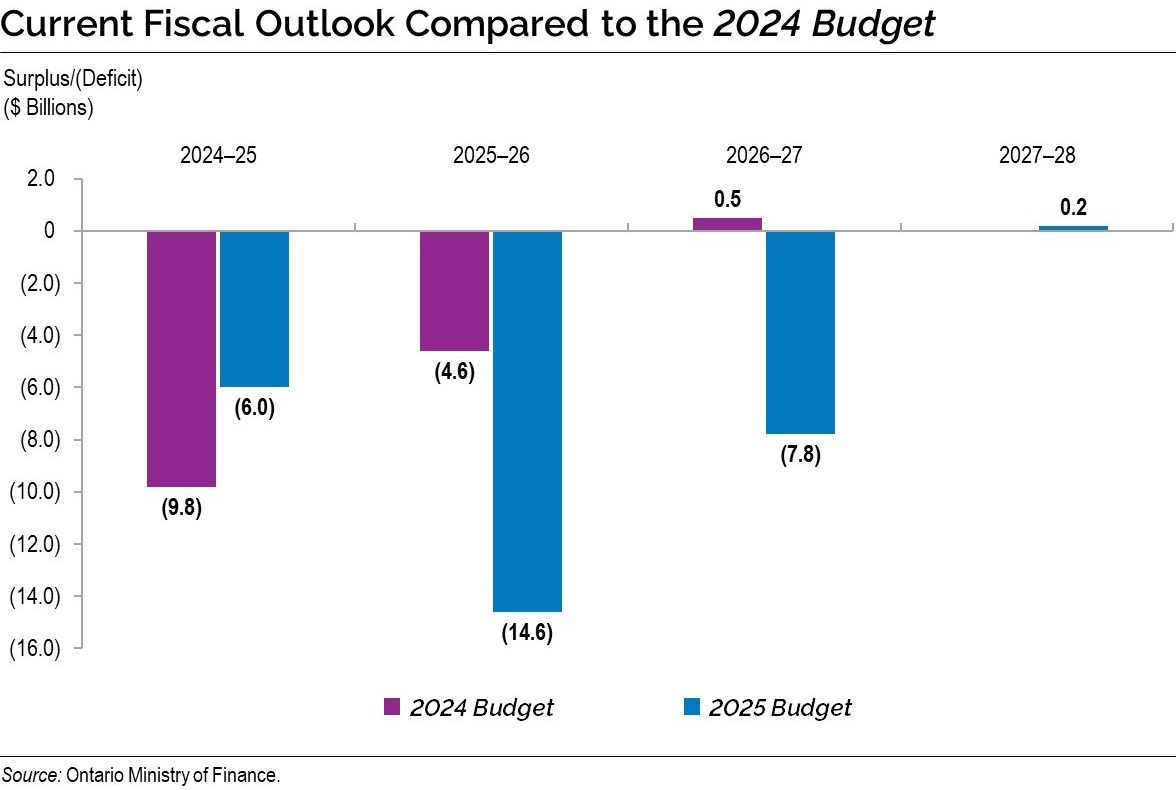
Chart: Current Fiscal Outlook Compared to the 2024 Budget
The bar chart illustrates the fiscal outlooks presented in the 2024 Budget compared to the current outlook in the 2025 Budget. The 2024 Budget projected deficits of $9.8 billion in 2024–25, $4.6 billion in 2025–26, and a surplus of $0.5 billion in 2026–27. With the release of the 2025 Budget, the deficit projections have been revised to deficits of $6.0 billion in 2024–25, $14.6 billion in 2025–26 and $7.8 billion in 2026–27, and a surplus of $0.2 billion in 2027–28.
Source: Ontario Ministry of Finance.
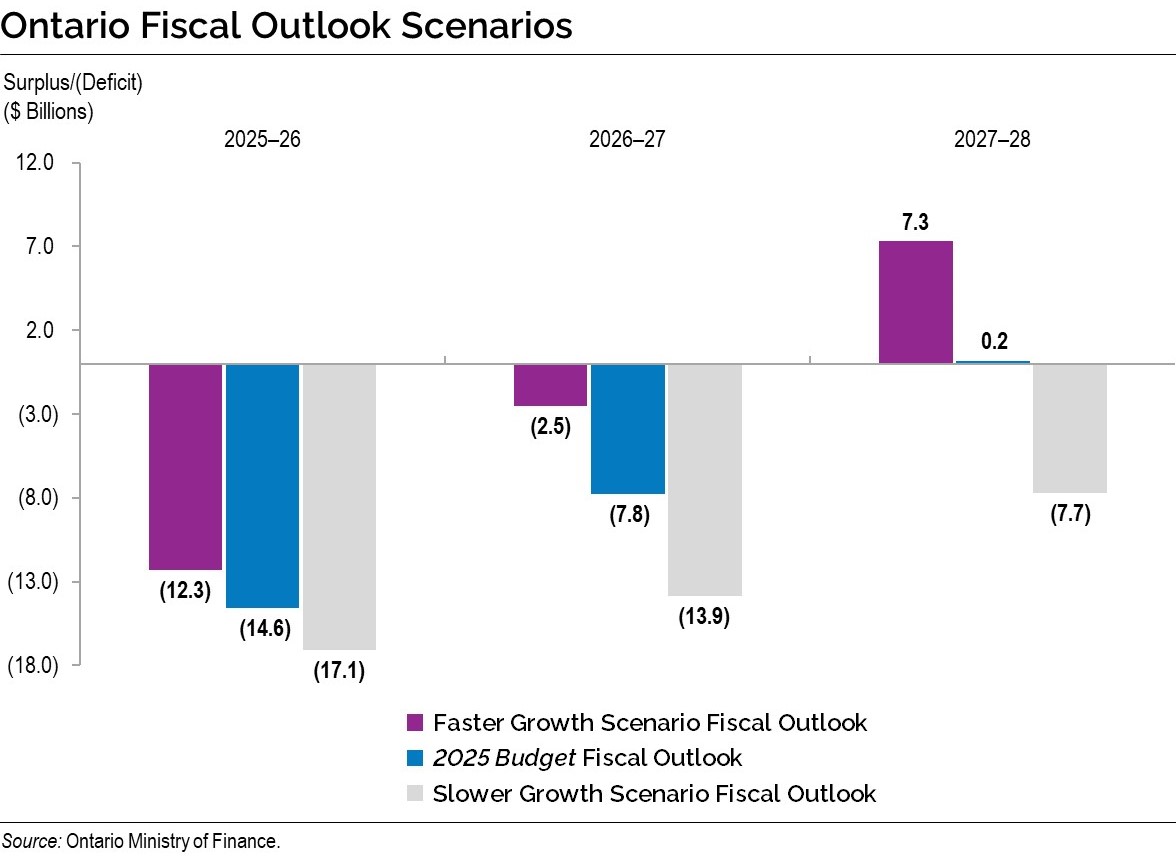
Chart: Ontario Fiscal Outlook Scenarios
The bar chart illustrates the range of Ontario fiscal outlooks based on the two alternative economic scenarios presented in Chapter 2: Economic Performance and Outlook. The 2025 Budget outlook estimates the deficit to be $14.6 billion in 2025–26 and $7.8 billion in 2026–27, followed by a surplus of $0.2 billion in 2027–28. Under the Faster Growth scenario, the deficit outlook is estimated to be $12.3 billion in 2025–26, $2.5 billion in 2026–27, followed by a surplus of $7.3 billion in 2027–28. Under the Slower Growth scenario, the deficit outlook is estimated to be $17.1 billion in 2025–26, $13.9 billion in 2026–27 and $7.7 billion in 2027–28.
Source: Ontario Ministry of Finance.