Ontario’s Economic and Fiscal Outlook in Brief
Ontario continues to face a period of heightened economic uncertainty amid unwarranted U.S. trade and tariff tensions, ongoing geopolitical conflicts, and disruptions to global supply chains. These external pressures are weighing on economic growth and creating challenges for businesses and workers across the province. At the same time, Ontario is responding to increasing demand for health care, education, and other critical public services as communities grow and their needs evolve.
Despite these challenges, Ontario’s prudent fiscal management has provided the flexibility needed to respond to challenging economic conditions while continuing to invest in priorities that matter to families and communities. The government has a plan to strengthen domestic economic opportunities, diversify its export markets, reduce internal trade barriers, protect businesses and local jobs and invest in building long-term prosperity. By balancing responsible fiscal stewardship with investments in essential public services and critical infrastructure, Ontario is helping to build a stronger, more resilient economy while maintaining a sustainable fiscal path for future generations.
In the recently released Public Accounts of Ontario 2025–2026, Ontario reported a $13.0 billion deficit in 2025–26, compared to a forecasted deficit of $14.6 billion in the 2025 Budget. The government remains committed to eliminating the province’s structural deficit and achieving a balanced budget.
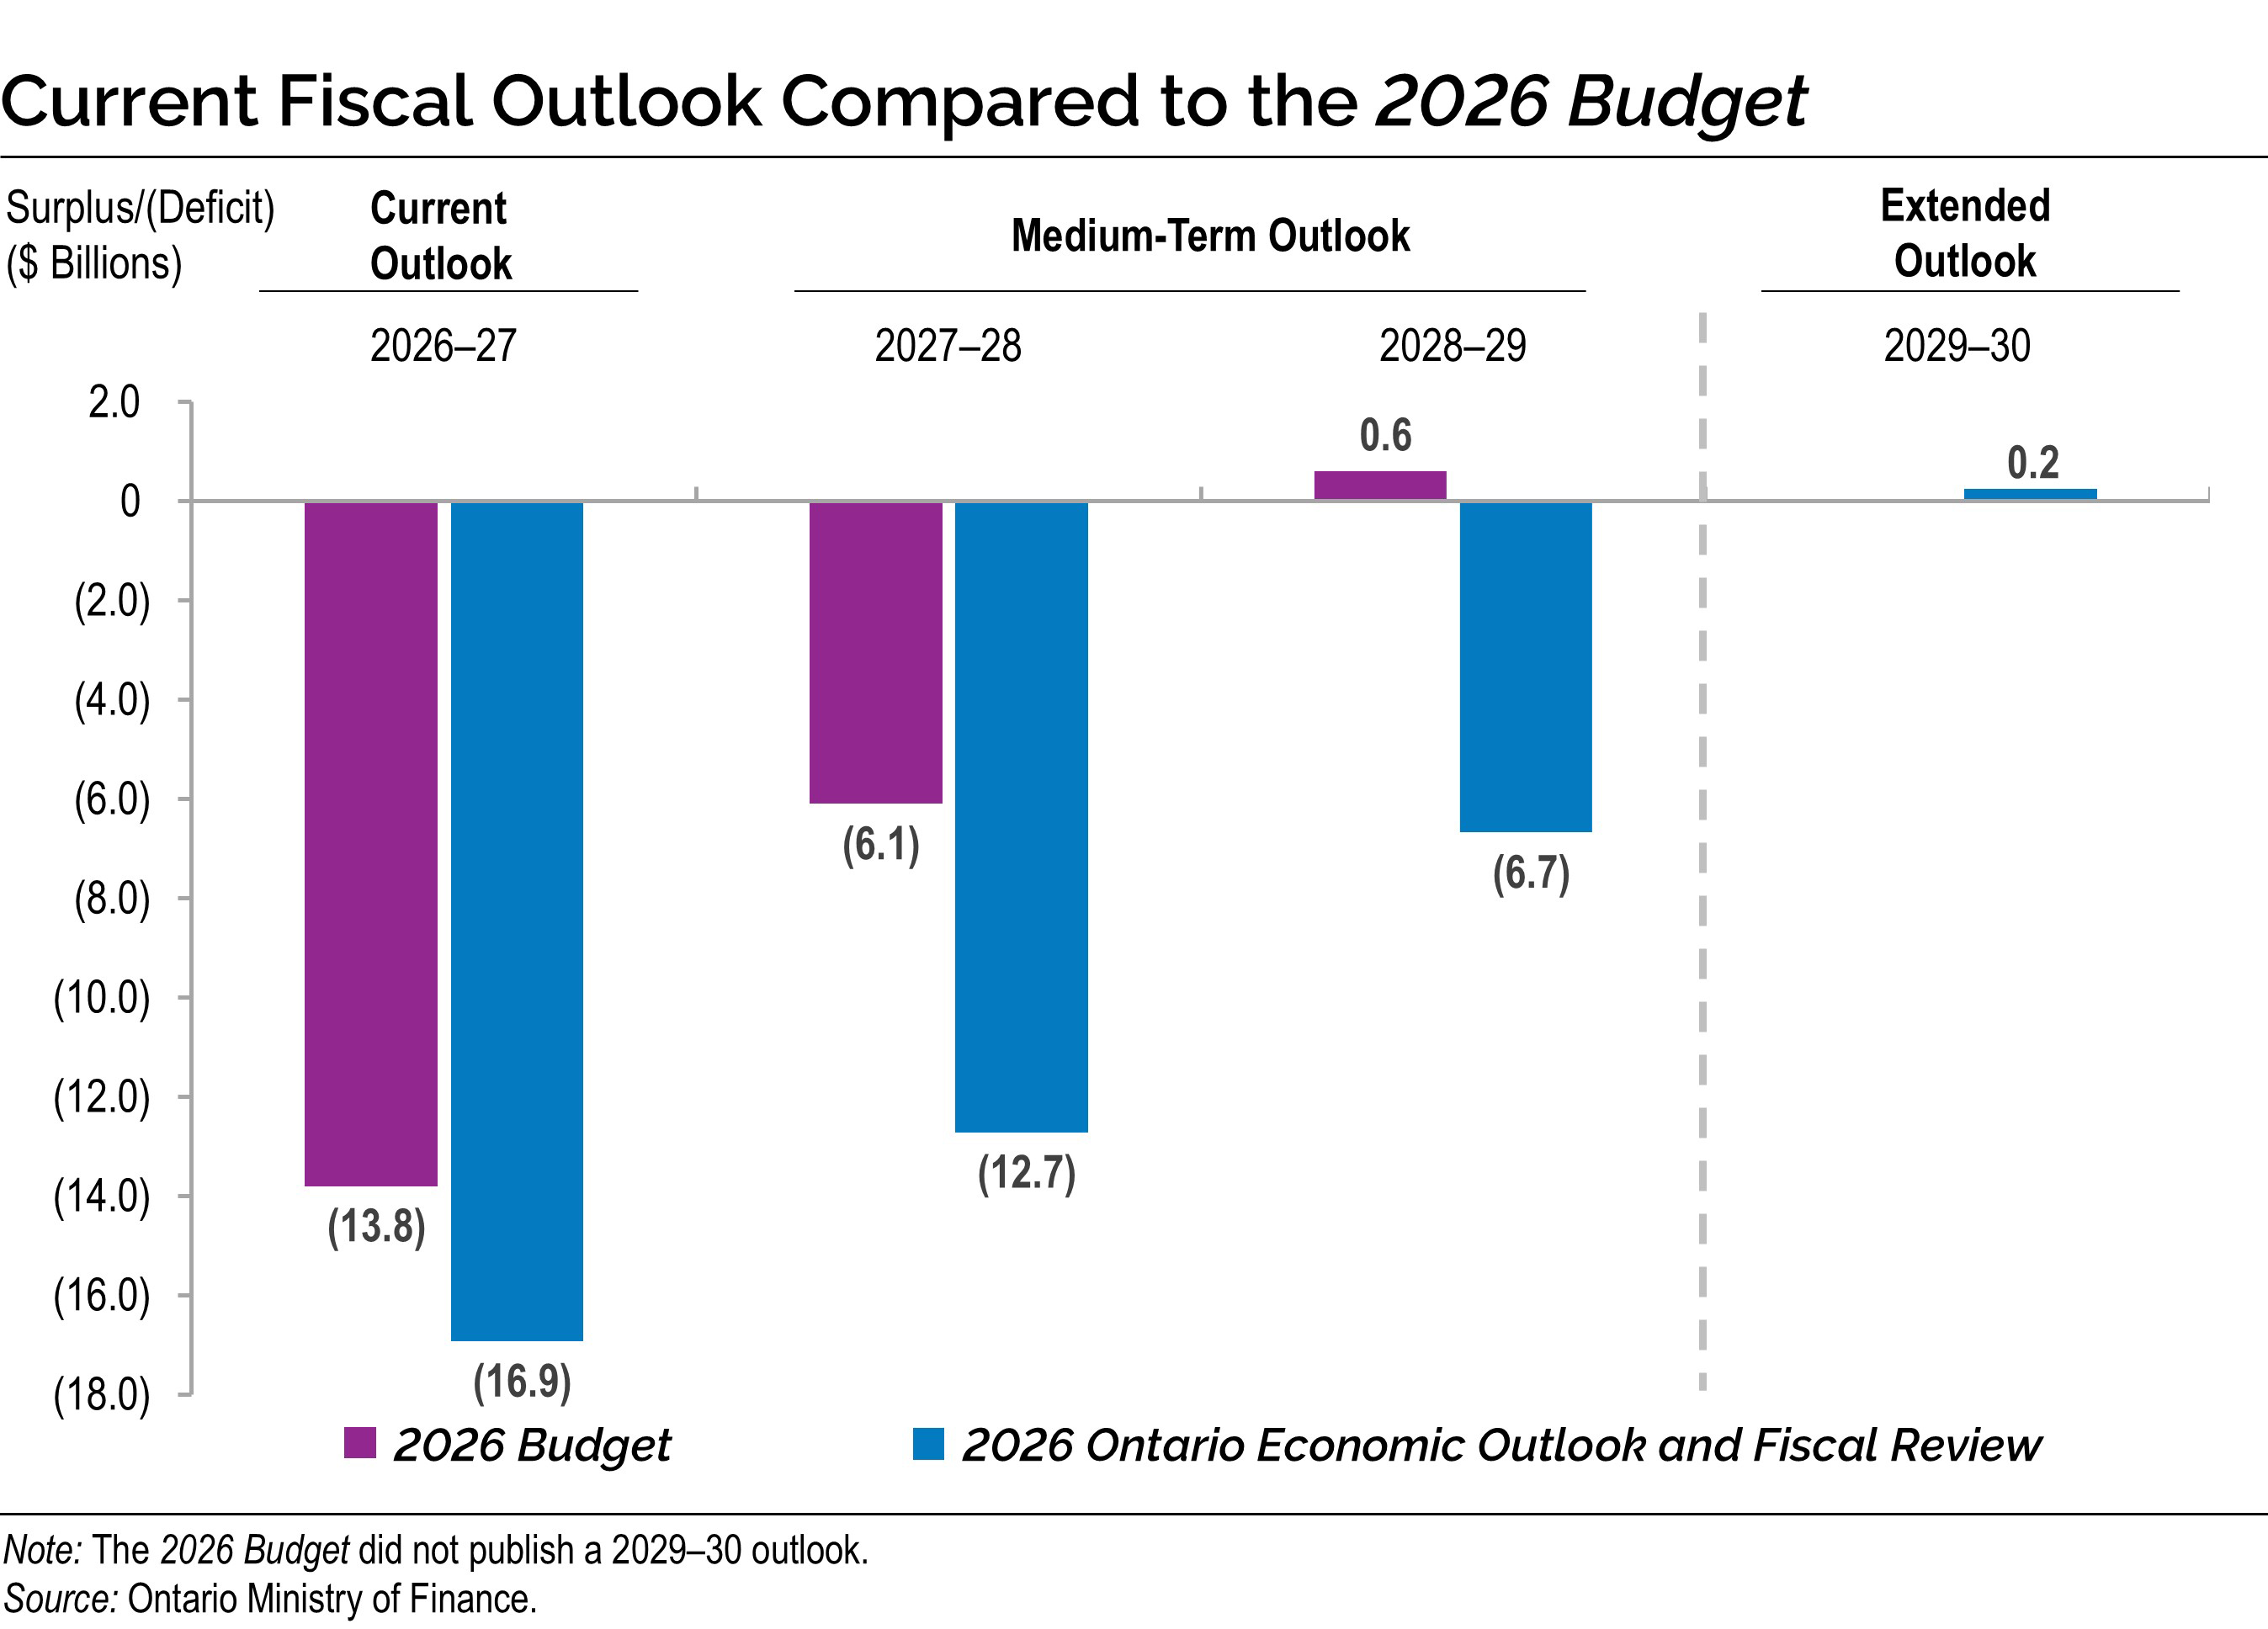
In 2026–27, Ontario is projecting a deficit of $16.9 billion. Over the medium term, the government is projecting deficits of $12.7 billion in 2027–28 and $6.7 billion in 2028–29. Evolving economic and fiscal pressures are expected to moderate the pace of fiscal improvement. The government is projecting a return to balance in 2029–30 in the extended outlook.
Ontario’s real gross domestic product (GDP) is projected to grow by 0.5 per cent in 2026 and is expected to pick up in subsequent years, with increases of 1.5 per cent in 2027, 1.8 per cent in 2028 and 2.0 per cent in 2029. For the purposes of prudent fiscal planning, these projections are set slightly below the average of private-sector forecasts.
The net debt-to-GDP ratio is forecast to be 37.4 per cent in 2026–27, compared with the forecast of 37.7 per cent in the 2026 Budget. Ontario’s fiscal plan keeps this ratio below its target level of 40.0 per cent over the medium-term outlook, demonstrating its commitment to managing the debt burden in a sustainable manner. Further illustrating Ontario’s commitment to responsible fiscal management, the interest-to-revenue ratio is forecast to be 6.7 per cent in 2026–27 and remains at or below its target level of 7.5 per cent over the medium-term outlook.
Ontario’s Economic Outlook
Ontario’s real GDP growth has been impacted by U.S. trade policy and tariffs. Growth is projected to decelerate from 1.3 per cent in 2025 to 0.5 per cent in 2026 before picking up in subsequent years, with increases of 1.5 per cent in 2027, 1.8 per cent in 2028 and 2.0 per cent in 2029. For the purposes of prudent fiscal planning, these projections are set slightly below the average of private‑sector forecasts.
| Item | 2025 | 2026p | 2027p | 2028p | 2029p |
|---|---|---|---|---|---|
| Real GDP Growth | 1.3 | 0.5 | 1.5 | 1.8 | 2.0 |
| Nominal GDP Growth | 4.1 | 3.7 | 3.8 | 3.9 | 4.0 |
| Employment Growth | 1.0 | 0.4 | 0.6 | 0.7 | 1.2 |
| CPI Inflation | 1.9 | 2.3 | 2.1 | 2.0 | 2.0 |
Table footnotes:
p = Ontario Ministry of Finance planning projection based on external sources as of September 11, 2026.
Sources: Statistics Canada and Ontario Ministry of Finance.
Revisions to the Economic Outlook Since the 2026 Budget
The outlook has been revised compared to the projections in the 2026 Budget. Key changes since the 2026 Budget include the following:
- Lower real GDP growth in 2026 and 2027;
- Stronger growth in nominal GDP and its drivers in 2026, including compensation of employees, net operating surplus of corporations and nominal household consumption; and
- Lower unemployment rate over the projection period.
| Item | 2026p 2026 Budget |
2026p 2026 FES |
2027p 2026 Budget |
2027p 2026 FES |
2028p 2026 Budget |
2028p 2026 FES |
2029p 2026 Budget |
2029p 2026 FES |
|---|---|---|---|---|---|---|---|---|
| Real Gross Domestic Product | 1.0 | 0.5 | 1.7 | 1.5 | 1.8 | 1.8 | 2.0 | 2.0 |
| Nominal Gross Domestic Product | 3.2 | 3.7 | 3.9 | 3.8 | 3.7 | 3.9 | 3.9 | 4.0 |
| Compensation of Employees | 3.2 | 3.4 | 3.3 | 3.0 | 3.5 | 3.1 | 3.8 | 3.8 |
| Net Operating Surplus — Corporations | 4.7 | 7.9 | 7.2 | 6.9 | 6.1 | 6.4 | 6.0 | 5.7 |
| Nominal Household Consumption | 3.3 | 3.6 | 3.4 | 3.2 | 3.6 | 3.4 | 3.7 | 3.8 |
| Other Economic Indicators — Employment | 0.5 | 0.4 | 0.7 | 0.6 | 0.8 | 0.7 | 1.1 | 1.2 |
| Other Economic Indicators — Job Creation (000s) | 41 | 33 | 58 | 50 | 67 | 58 | 92 | 104 |
| Other Economic Indicators — Unemployment Rate (Per Cent) | 7.4 | 7.2 | 6.9 | 6.7 | 6.4 | 6.3 | 6.2 | 6.1 |
| Other Economic Indicators — Consumer Price Index | 2.1 | 2.3 | 2.0 | 2.1 | 2.0 | 2.0 | 2.0 | 2.0 |
| Other Economic Indicators — Housing Starts (000s)1 | 64.8 | 64.7 | 70.3 | 65.1 | 76.8 | 71.7 | 80.5 | 75.4 |
| Other Economic Indicators — Home Resales | 9.1 | (0.7) | 5.6 | 7.8 | 4.6 | 5.1 | 1.5 | 5.3 |
| Other Economic Indicators — Home Resale Prices | 0.8 | (2.4) | 2.7 | 1.4 | 4.2 | 4.2 | 4.0 | 4.6 |
| Key External Variables — U.S. Real Gross Domestic Product | 2.4 | 2.1 | 2.1 | 2.0 | 2.0 | 2.0 | 1.9 | 2.0 |
| Key External Variables — WTI Crude Oil ($US per Barrel) | 59 | 83 | 62 | 74 | 67 | 70 | 69 | 71 |
| Key External Variables — Canadian Dollar (Cents US) | 73.2 | 72.3 | 75.3 | 73.7 | 76.4 | 74.6 | 76.6 | 75.1 |
| Key External Variables — Three-Month Treasury Bill Rate (Per Cent)2 | 2.3 | 2.3 | 2.6 | 2.5 | 2.5 | 2.6 | 2.6 | 2.6 |
| Key External Variables — 10-Year Government Bond Rate (Per Cent)3 | 3.3 | 3.5 | 3.5 | 3.6 | 3.5 | 3.6 | 3.5 | 3.6 |
Table footnotes:
p = Ontario Ministry of Finance planning projection based on external sources as of September 11, 2026.
[1] Housing starts projection based on private-sector average as of September 11, 2026.
[2], [3] Government of Canada interest rates.
Sources: Statistics Canada; Canada Mortgage and Housing Corporation; Canadian Real Estate Association; Bank of Canada; United States Bureau of Economic Analysis; Blue Chip Economic Indicators; U.S. Energy Information Administration; and Ontario Ministry of Finance.
Respecting Taxpayer Dollars
The government’s plan is consistent with the Fiscal Sustainability, Transparency and Accountability Act, 2019 and its governing principles that guide Ontario’s fiscal policy.
- Transparent: The government continues to be transparent through the release of regular fiscal updates. This is the ninth year in a row that the government has received a clean audit opinion from Ontario’s Auditor General.
- Responsible: The government has developed a measured and accountable approach to managing Ontario’s finances, while investing in key public services and capital projects.
- Flexible: The government’s plan has built in appropriate levels of prudence in the form of a contingency fund and a reserve to ensure the necessary fiscal flexibility is available to respond to changing circumstances.
- Equitable: The government’s plan sustains investments in key public services, such as health care, social services and education, ensuring that these services are readily available for the people of today and maintained for the benefit of future generations.
- Sustainable: The government remains committed to achieving a balanced budget and reducing the province’s debt burden to ensure the long-term sustainability of Ontario’s finances.
Ontario continues to advance initiatives that prioritize respect for taxpayers, strengthen government operations, improve stewardship of public resources and support the efficient delivery of public services. Efforts are focused on strengthening oversight, accountability and program integrity across government and the broader public sector to ensure resources are directed to priority outcomes for people in Ontario. This includes strengthening payment integrity, reducing fraud, error, waste and abuse, and reviewing key provincial agencies to assess operational efficiency, financial performance and long-term sustainability. Together, these efforts help improve service delivery, enhance value for taxpayers and support responsible fiscal management.
Ontario has made progress in reviewing priority areas to identify efficiencies, manage cost pressures, and improve program and service delivery. For example, the government is:
- Identifying opportunities to reduce incidents of error, waste, abuse, and fraud across government‑funded programs, while strengthening program integrity, oversight, and compliance;
- To maintain affordability and ensure sustainability of the Ontario Electricity Rebate (OER), effective May 1, 2027, the government’s continued monthly credit will be capped at 1,200 kilowatt-hours (kWh) for residential customers. The average residential consumer in Ontario uses approximately 700 kWh per month. Small businesses and farms are excluded from this change. In addition, the government will continue to provide credits on top of the OER aimed at lowering energy costs for Northern and rural residents;
- Reviewing Ontario’s business support programs to identify opportunities for greater efficiency, stronger investment outcomes, and improved value for taxpayer dollars; and
- Continuing to work with sector partners to ensure accountable and improved service delivery, without impacting frontline workers.
The progress made will reinforce momentum and support the long-term, sustainable delivery of public services.
Prudent management is an ongoing effort, and the government continues to explore opportunities to create capacity to advance government priorities and manage growth pressures.
In addition, the government has taken action to strengthen oversight and cost management across the provincial agency sector. These actions build on the provincial agency hiring freeze, which has helped stabilize staffing growth and avoid nearly $300 million in costs.
The government will also seek to further decrease and streamline political staff offices to encourage comparable savings across the enterprise.
Ontario’s Fiscal Plan
The government recorded a $13.0 billion deficit for the fiscal year 2025–26, compared to a forecasted deficit of $14.6 billion in the 2025 Budget. In 2026–27, the government is projecting a deficit of $16.9 billion. Over the medium term, the government is forecasting deficits of $12.7 billion in 2027–28 and $6.7 billion in 2028–29. The government is projecting a return to balance in 2029–30 in the extended outlook.
| Item | Actual 2025–26 |
Current Outlook 2026–27 |
Medium-Term Outlook 2027–28 |
Medium-Term Outlook 2028–29 |
Extended Outlook 2029–30 |
|---|---|---|---|---|---|
| Revenue — Personal Income Tax | 57.0 | 63.4 | 65.9 | 69.9 | 74.1 |
| Revenue — Sales Tax | 39.3 | 40.7 | 42.4 | 44.6 | 46.8 |
| Revenue — Corporations Tax | 28.3 | 30.2 | 31.6 | 33.0 | 34.5 |
| Revenue — Ontario Health Premium | 5.2 | 5.6 | 5.8 | 6.0 | 6.2 |
| Revenue — Education Property Tax | 6.0 | 6.0 | 6.0 | 6.1 | 6.1 |
| Revenue — All Other Taxes | 17.3 | 16.9 | 17.5 | 18.4 | 19.4 |
| Total Taxation Revenue | 153.0 | 162.8 | 169.3 | 178.0 | 187.0 |
| Government of Canada Transfers | 39.1 | 40.7 | 39.9 | 40.2 | 40.4 |
| Income from Government Business Enterprises | 7.7 | 7.1 | 6.6 | 7.0 | 7.5 |
| Other Non-Tax Revenue | 23.5 | 21.9 | 22.4 | 22.7 | 22.9 |
| Total Revenue | 223.3 | 232.6 | 238.2 | 247.9 | 257.8 |
| Base Programs — Health Sector | 97.5 | 100.7 | 103.0 | 106.2 | 108.2 |
| Base Programs — Education Sector2 | 40.1 | 40.2 | 40.7 | 41.0 | 41.4 |
| Base Programs — Postsecondary Education Sector | 13.9 | 13.9 | 12.7 | 12.6 | 12.6 |
| Base Programs — Children, Community and Social Services Sector | 21.4 | 21.4 | 21.6 | 21.7 | 21.8 |
| Base Programs — Justice Sector | 7.2 | 7.2 | 7.3 | 7.3 | 7.4 |
| Base Programs — Other Programs | 40.7 | 42.7 | 43.1 | 41.5 | 41.5 |
| Total Base Programs | 220.9 | 226.1 | 228.4 | 230.3 | 232.8 |
| Contingency Fund Top-Up | – | 3.8 | – | – | – |
| Total Programs | 220.9 | 229.9 | 228.4 | 230.3 | 232.8 |
| Interest and Other Debt Servicing Charges | 15.5 | 17.4 | 18.9 | 20.4 | 21.1 |
| Total Expense | 236.3 | 247.3 | 247.3 | 250.8 | 253.8 |
| Surplus/(Deficit) Before Reserve | (13.0) | (14.7) | (9.1) | (2.9) | 4.0 |
| Reserve | – | 2.2 | 3.6 | 3.8 | 3.8 |
| Surplus/(Deficit) | (13.0) | (16.9) | (12.7) | (6.7) | 0.2 |
| Net Debt as a Per Cent of GDP | 36.5% | 37.4% | 38.7% | 38.9% | 38.3% |
| Net Debt as a Per Cent of Revenue | 205.7% | 209.7% | 219.9% | 220.3% | 217.0% |
| Interest as a Per Cent of Revenue | 6.0% | 6.7% | 7.2% | 7.5% | 7.5% |
Table footnotes:
[1] Beginning in 2024–25, the inter-entity revenue and expense balances on Employer Health Tax (EHT) are eliminated. This change is fiscally neutral.
[2] Excludes Teachers’ Pension Plan. Teachers’ Pension Plan expense is included in Other Programs.
Note: Numbers may not add due to rounding.
Sources: Ontario Treasury Board Secretariat and Ontario Ministry of Finance.
Revenue Outlook Over the Medium Term
Ontario’s revenue outlook is anchored by an economic projection based on private-sector forecasts and the best available information at the time of finalizing the planning projection. Between 2025–26 and 2028–29, revenues are expected to grow, on average, by 3.5 per cent a year. Details of the medium-term revenue outlook are outlined later in this document. See Chapter 3: Ontario’s Fiscal Plan and Outlook for more details.
Key inputs included in the revenue forecast are a prudent economic outlook based on private‑sector forecasts; existing federal–provincial agreements and funding formulas; and the business plans of government ministries, business enterprises and service organizations.
Program Expense Outlook Over the Medium Term
The government is maintaining a strong fiscal foundation while continuing to sustain investments in key public services. Ontario’s base program expense outlook is expected to grow each year from $220.9 billion in 2025–26 to $230.3 billion in 2028–29. This reflects the government’s commitment to key public services such as health care, education and infrastructure.
As part of the government’s strategy for responsible fiscal management, the government continues to project revenue growth exceeding program expense growth as highlighted in the 2026 Budget. The program expense outlook also includes contingency funds to support fiscal stability and provide flexibility to respond to unforeseen events.
See Chapter 3: Ontario’s Fiscal Plan and Outlook for further details on the program expense outlook over the medium term.
Interest and Other Debt Servicing Charges Outlook Over the Medium Term
Interest and Other Debt Servicing Charges is forecast to be $17.4 billion in 2026–27, $18.9 billion in 2027–28 and $20.4 billion in 2028–29.
See Chapter 4: Borrowing and Debt Management for further details on the outlook over the medium term.
Revisions to the Fiscal Outlook Since the 2026 Budget
The 2026 Ontario Economic Outlook and Fiscal Review has been revised compared to the projections in the 2026 Budget.
| Item | 2026–27 | 2027–28 | 2028–29 |
|---|---|---|---|
| Surplus/(Deficit) from 2026 Budget | (13.8) | (6.1) | 0.6 |
| Total Revenue Changes | 2.0 | (3.9) | (4.9) |
| Expense Changes — Net Program Expense Changes | 4.3 | 0.7 | 0.3 |
| Expense Changes — Interest and Other Debt Servicing Charges | 0.1 | 0.4 | 0.7 |
| Total Expense Changes | 4.4 | 1.1 | 1.0 |
| Change in Reserve | 0.7 | 1.6 | 1.3 |
| Fiscal Improvement/(Deterioration) | (3.1) | (6.6) | (7.2) |
| 2026 Ontario Economic Outlook and Fiscal Review Surplus/(Deficit) | (16.9) | (12.7) | (6.7) |
Table footnotes:
[1] Beginning in 2024–25, the inter-entity revenue and expense balances on Employer Health Tax (EHT) are eliminated. This change is fiscally neutral.
Note: Numbers may not add due to rounding.
Key changes include the following:
- Total revenue is projected to increase by $2.0 billion in 2026–27, mainly due to higher‑than‑expected federal transfers, net income from Government Business Enterprises and taxation revenue. Over the medium term, total revenue is projected to be $3.9 billion in 2027–28 and $4.9 billion in 2028–29 lower than in the 2026 Budget, primarily due to lower‑than-expected taxation revenues;
- Program expense is projected to increase by $4.3 billion in 2026–27, primarily due to the top-up to the Contingency Fund to protect key public services, address compensation‑related pressures, and provide flexibility to respond to unforeseen risks. Over the medium term, program expense is projected to increase by $0.7 billion in 2027–28 and $0.3 billion in 2028–29, mainly reflecting the Ontario New Home Affordability Payment (ONHAP) and additional prudence intended to respond to economic risks, and support potential measures to protect Ontario from the impacts of unwarranted U.S. tariffs and trade tensions;
- Interest and Other Debt Servicing Charges is forecast to increase by $0.1 billion in 2026–27, $0.4 billion in 2027–28 and $0.7 billion in 2028–29;
- The reserve has been increased by $0.7 billion in 2026–27, $1.6 billion in 2027–28 and $1.3 billion in 2028–29. This increase reflects ongoing extraordinary circumstances arising from economic and geopolitical uncertainty, including significant risks to Ontario’s economy related to trade, as well as the impact of proposed federal tax measures; and
- The government is projecting deficits of $16.9 billion in 2026–27, $12.7 billion in 2027–28, and $6.7 billion in 2028–29, representing a deterioration of $3.1 billion, $6.6 billion, and $7.2 billion, respectively, compared to the forecasts presented in the 2026 Budget.
Economic and Fiscal Outlook Scenarios
To provide more transparency about the province’s economic outlook amid the elevated degree of economic uncertainty, the Ontario Ministry of Finance has developed Faster Growth and Slower Growth scenarios that could impact the economy over the next few years. These alternative scenarios should not be considered the best case or the worst case; instead, they should be viewed as reasonable possible outcomes during this period of uncertainty. See Chapter 2: Economic Performance and Outlook for more details.
| Item | 2026p | 2027p | 2028p | 2029p |
|---|---|---|---|---|
| Faster Growth Scenario | 0.8 | 2.2 | 2.1 | 2.3 |
| Planning Projection | 0.5 | 1.5 | 1.8 | 2.0 |
| Slower Growth Scenario | 0.2 | 0.5 | 1.8 | 2.0 |
Table footnotes:
p = Ontario Ministry of Finance planning projection based on external sources as of September 11, 2026, and alternative scenarios.
Source: Ontario Ministry of Finance.
| Item | 2026p | 2027p | 2028p | 2029p |
|---|---|---|---|---|
| Faster Growth Scenario | 4.6 | 4.5 | 4.2 | 4.3 |
| Planning Projection | 3.7 | 3.8 | 3.9 | 4.0 |
| Slower Growth Scenario | 3.5 | 2.6 | 3.5 | 3.7 |
Table footnotes:
p = Ontario Ministry of Finance planning projection based on external sources as of September 11, 2026, and alternative scenarios.
Source: Ontario Ministry of Finance.
In the event that the alternative economic scenarios materialize, as opposed to the Planning Projection, Ontario’s fiscal plan would also change as a result.
Based on the two alternative nominal GDP growth economic scenarios, two taxation revenue outlook scenarios have been developed.
| Item | 2026–27p | 2027–28p | 2028–29p |
|---|---|---|---|
| Faster Growth Scenario | 165.5 | 174.6 | 185.5 |
| Planning Projection | 162.8 | 169.3 | 178.0 |
| Slower Growth Scenario | 161.2 | 164.3 | 170.7 |
Table footnotes:
p = Ontario Ministry of Finance planning projection based on external sources as of September 11, 2026, and alternative scenarios.
Note: Numbers may not add due to rounding.
Source: Ontario Ministry of Finance.
In the Faster Growth scenario, total taxation revenue over the medium term is $7.5 billion higher than the Planning Projection in 2028–29, while in the Slower Growth scenario, total taxation revenue is $7.3 billion lower.
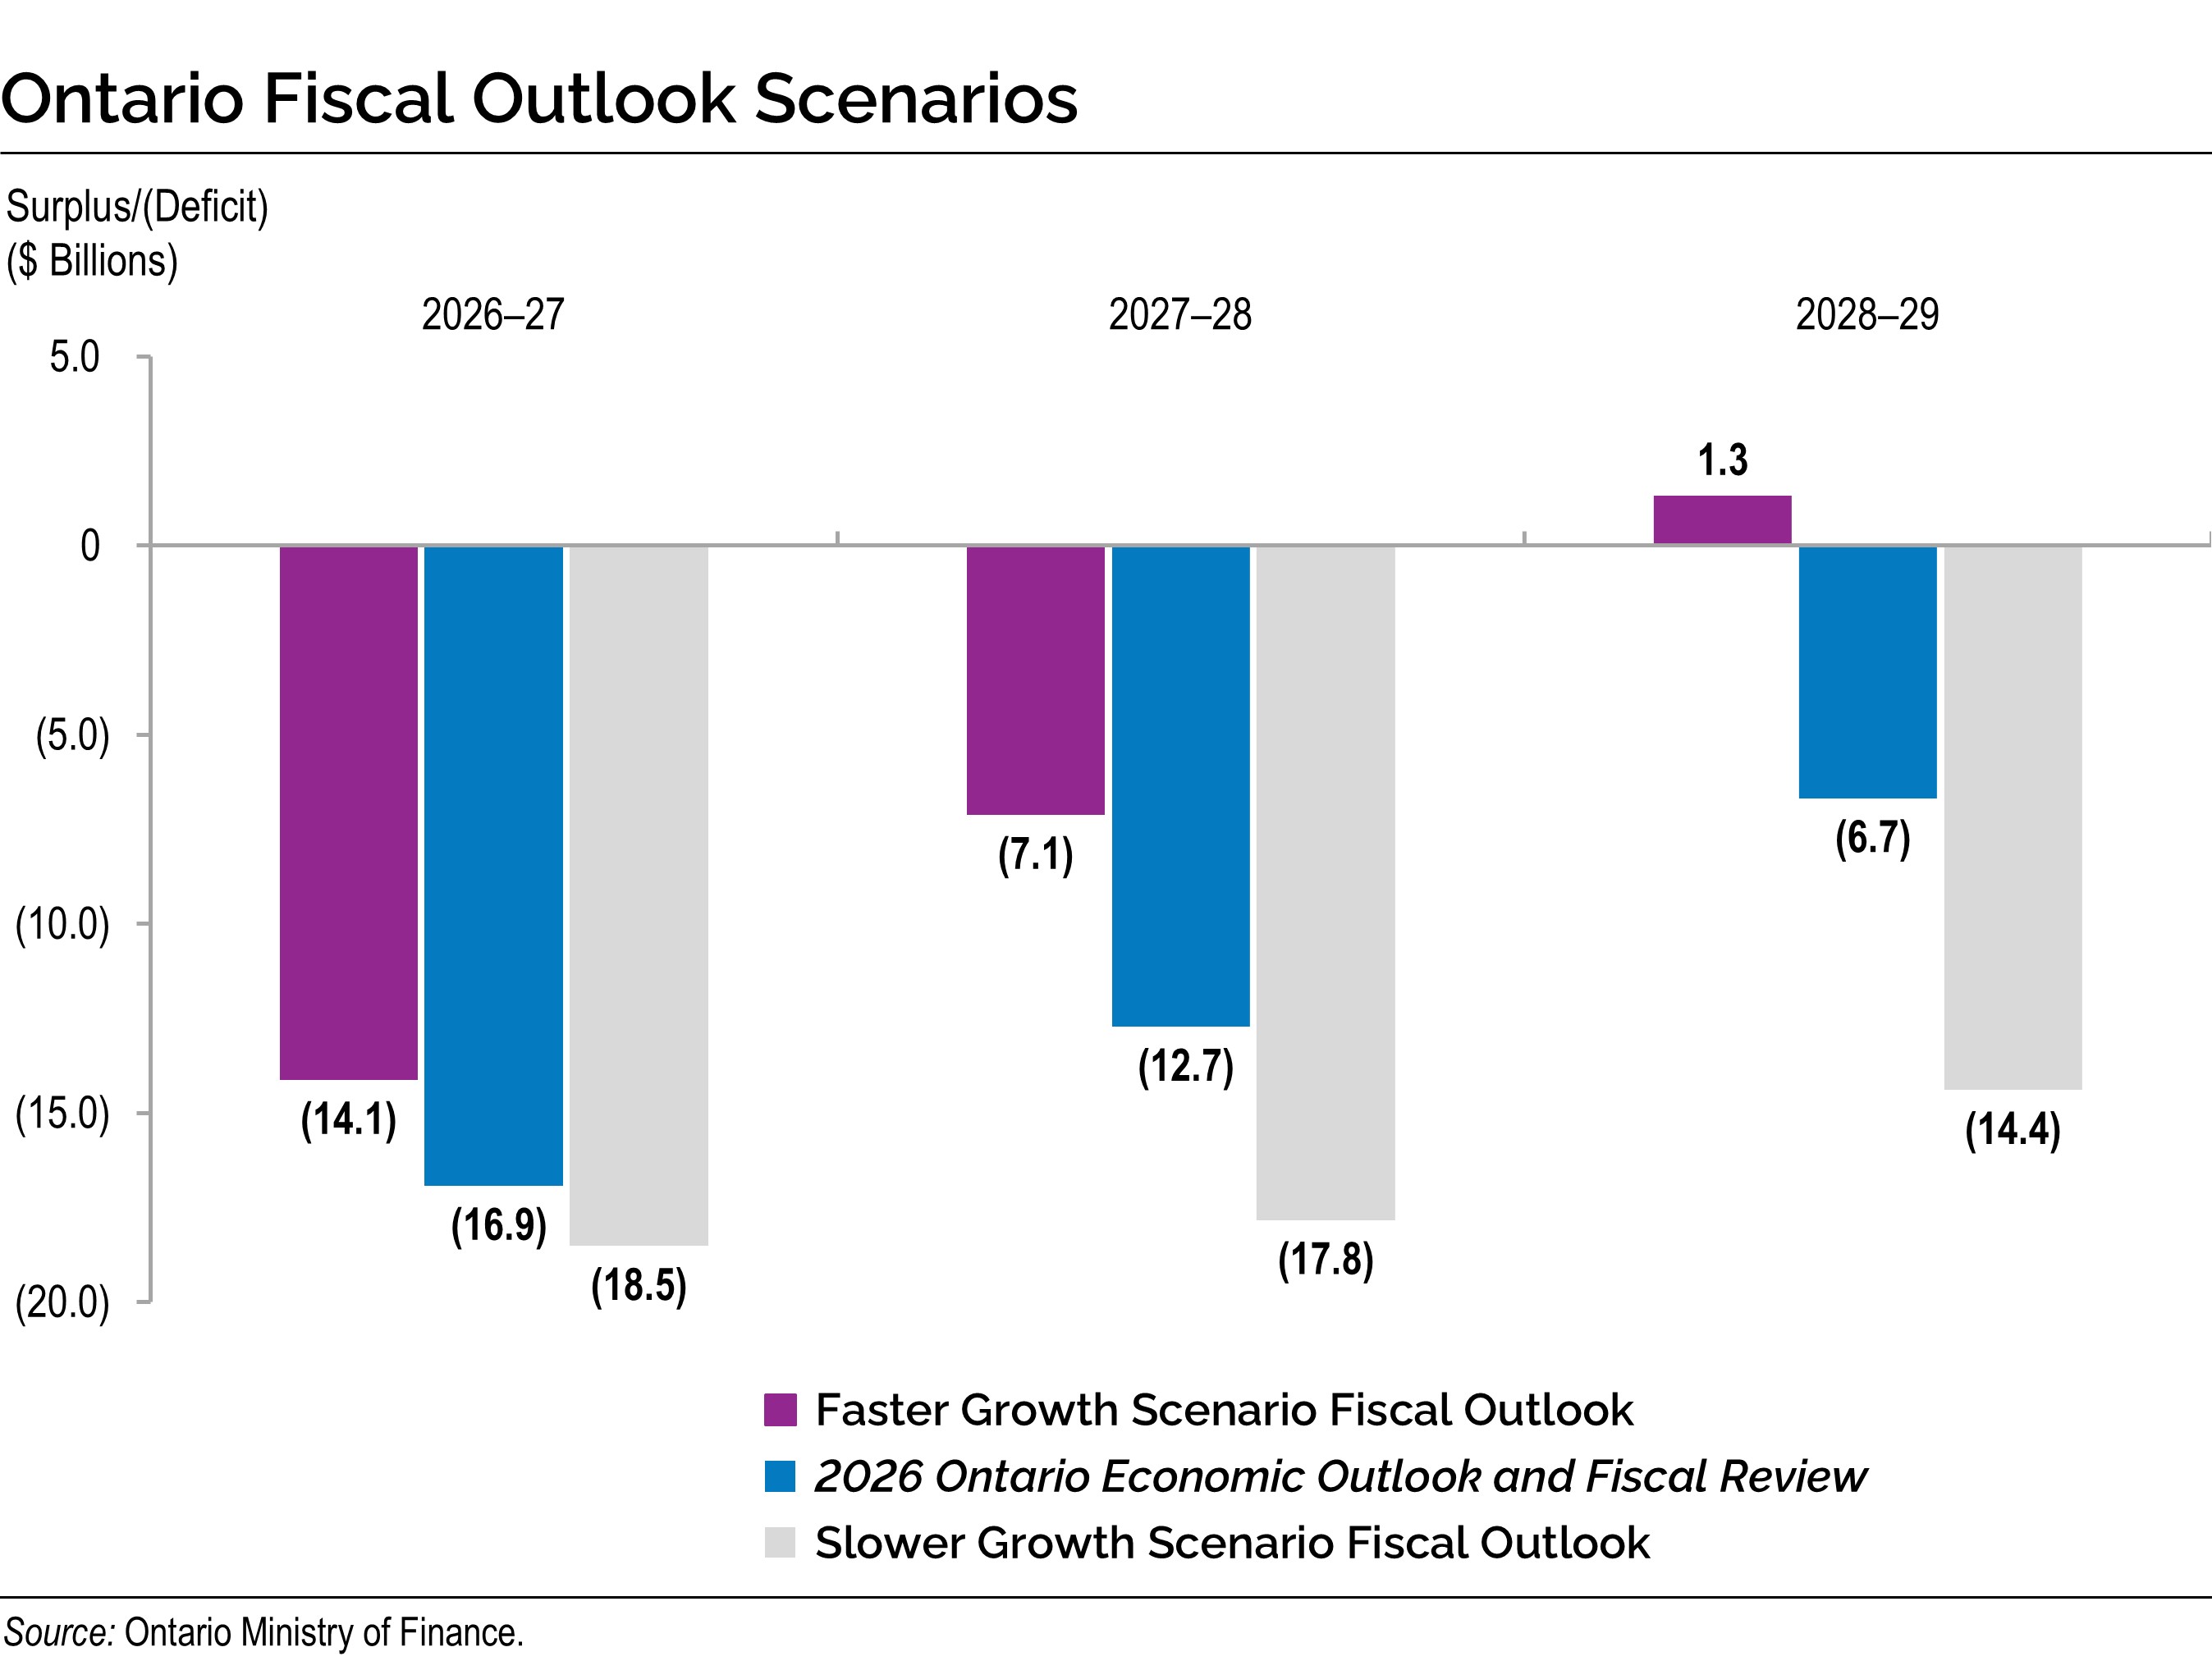
Under the Faster Growth scenario, the deficit outlook may improve to $14.1 billion in 2026–27, $7.1 billion in 2027–28, followed by a surplus of $1.3 billion in 2028–29. However, if the Slower Growth scenario materializes instead, the deficit outlook may deteriorate to $18.5 billion in 2026–27, $17.8 billion in 2027–28 and $14.4 billion in 2028–29.
Borrowing and Debt Management
Ontario’s long-term borrowing requirement for 2026–27 is now forecast to be $51.1 billion, an increase of $3.9 billion from the 2026 Budget forecast of $47.2 billion. As of October 8, 2026, Ontario had completed $36.3 billion, or 71.1 per cent, of the long-term public borrowing program.
| Item | 2026 Budget |
In-Year Change |
Current Outlook 2026–27 |
Medium-Term Outlook 2027–28 |
Medium-Term Outlook 2028–29 |
|---|---|---|---|---|---|
| Deficit/(Surplus) | 13.8 | 3.1 | 16.9 | 12.7 | 6.7 |
| Provincial Investment in Capital Assets | 28.0 | – | 28.0 | 28.0 | 22.4 |
| Amortization of Capital Assets | (10.2) | – | (10.2) | (10.5) | (11.4) |
| Non-Cash and Cash Timing Adjustments | (2.5) | (0.7) | (3.2) | (4.3) | (4.8) |
| Net Loans and Investments | 5.2 | 0.5 | 5.7 | 5.5 | 4.8 |
| Debt Maturities and Redemptions | 26.9 | – | 26.9 | 27.5 | 30.7 |
| Total Funding Requirement | 61.2 | 2.9 | 64.1 | 59.0 | 48.4 |
| Decrease/(Increase) in Short-Term Borrowing | (6.0) | (2.0) | (8.0) | (6.0) | – |
| Increase/(Decrease) in Year-End Cash and Cash Equivalents | (8.0) | 3.0 | (5.0) | (5.0) | (3.0) |
| Total Long-Term Borrowing | 47.2 | 3.9 | 51.1 | 48.0 | 45.4 |
Table footnotes:
Note: Numbers may not add due to rounding.
Source: Ontario Financing Authority.
Global demand for Ontario’s debt remains at unprecedented levels among investors, supported by a strong fiscal track record and solid credit ratings. Increased global demand, coupled with Ontario’s professional and innovative approach to markets, has led to increased foreign issuance, continued diversification of Ontario’s investor base and reduced overall borrowing costs. The province remained agile in order to take advantage of market opportunities to achieve innovative and cost‑effective borrowings while maintaining prudent reserves.
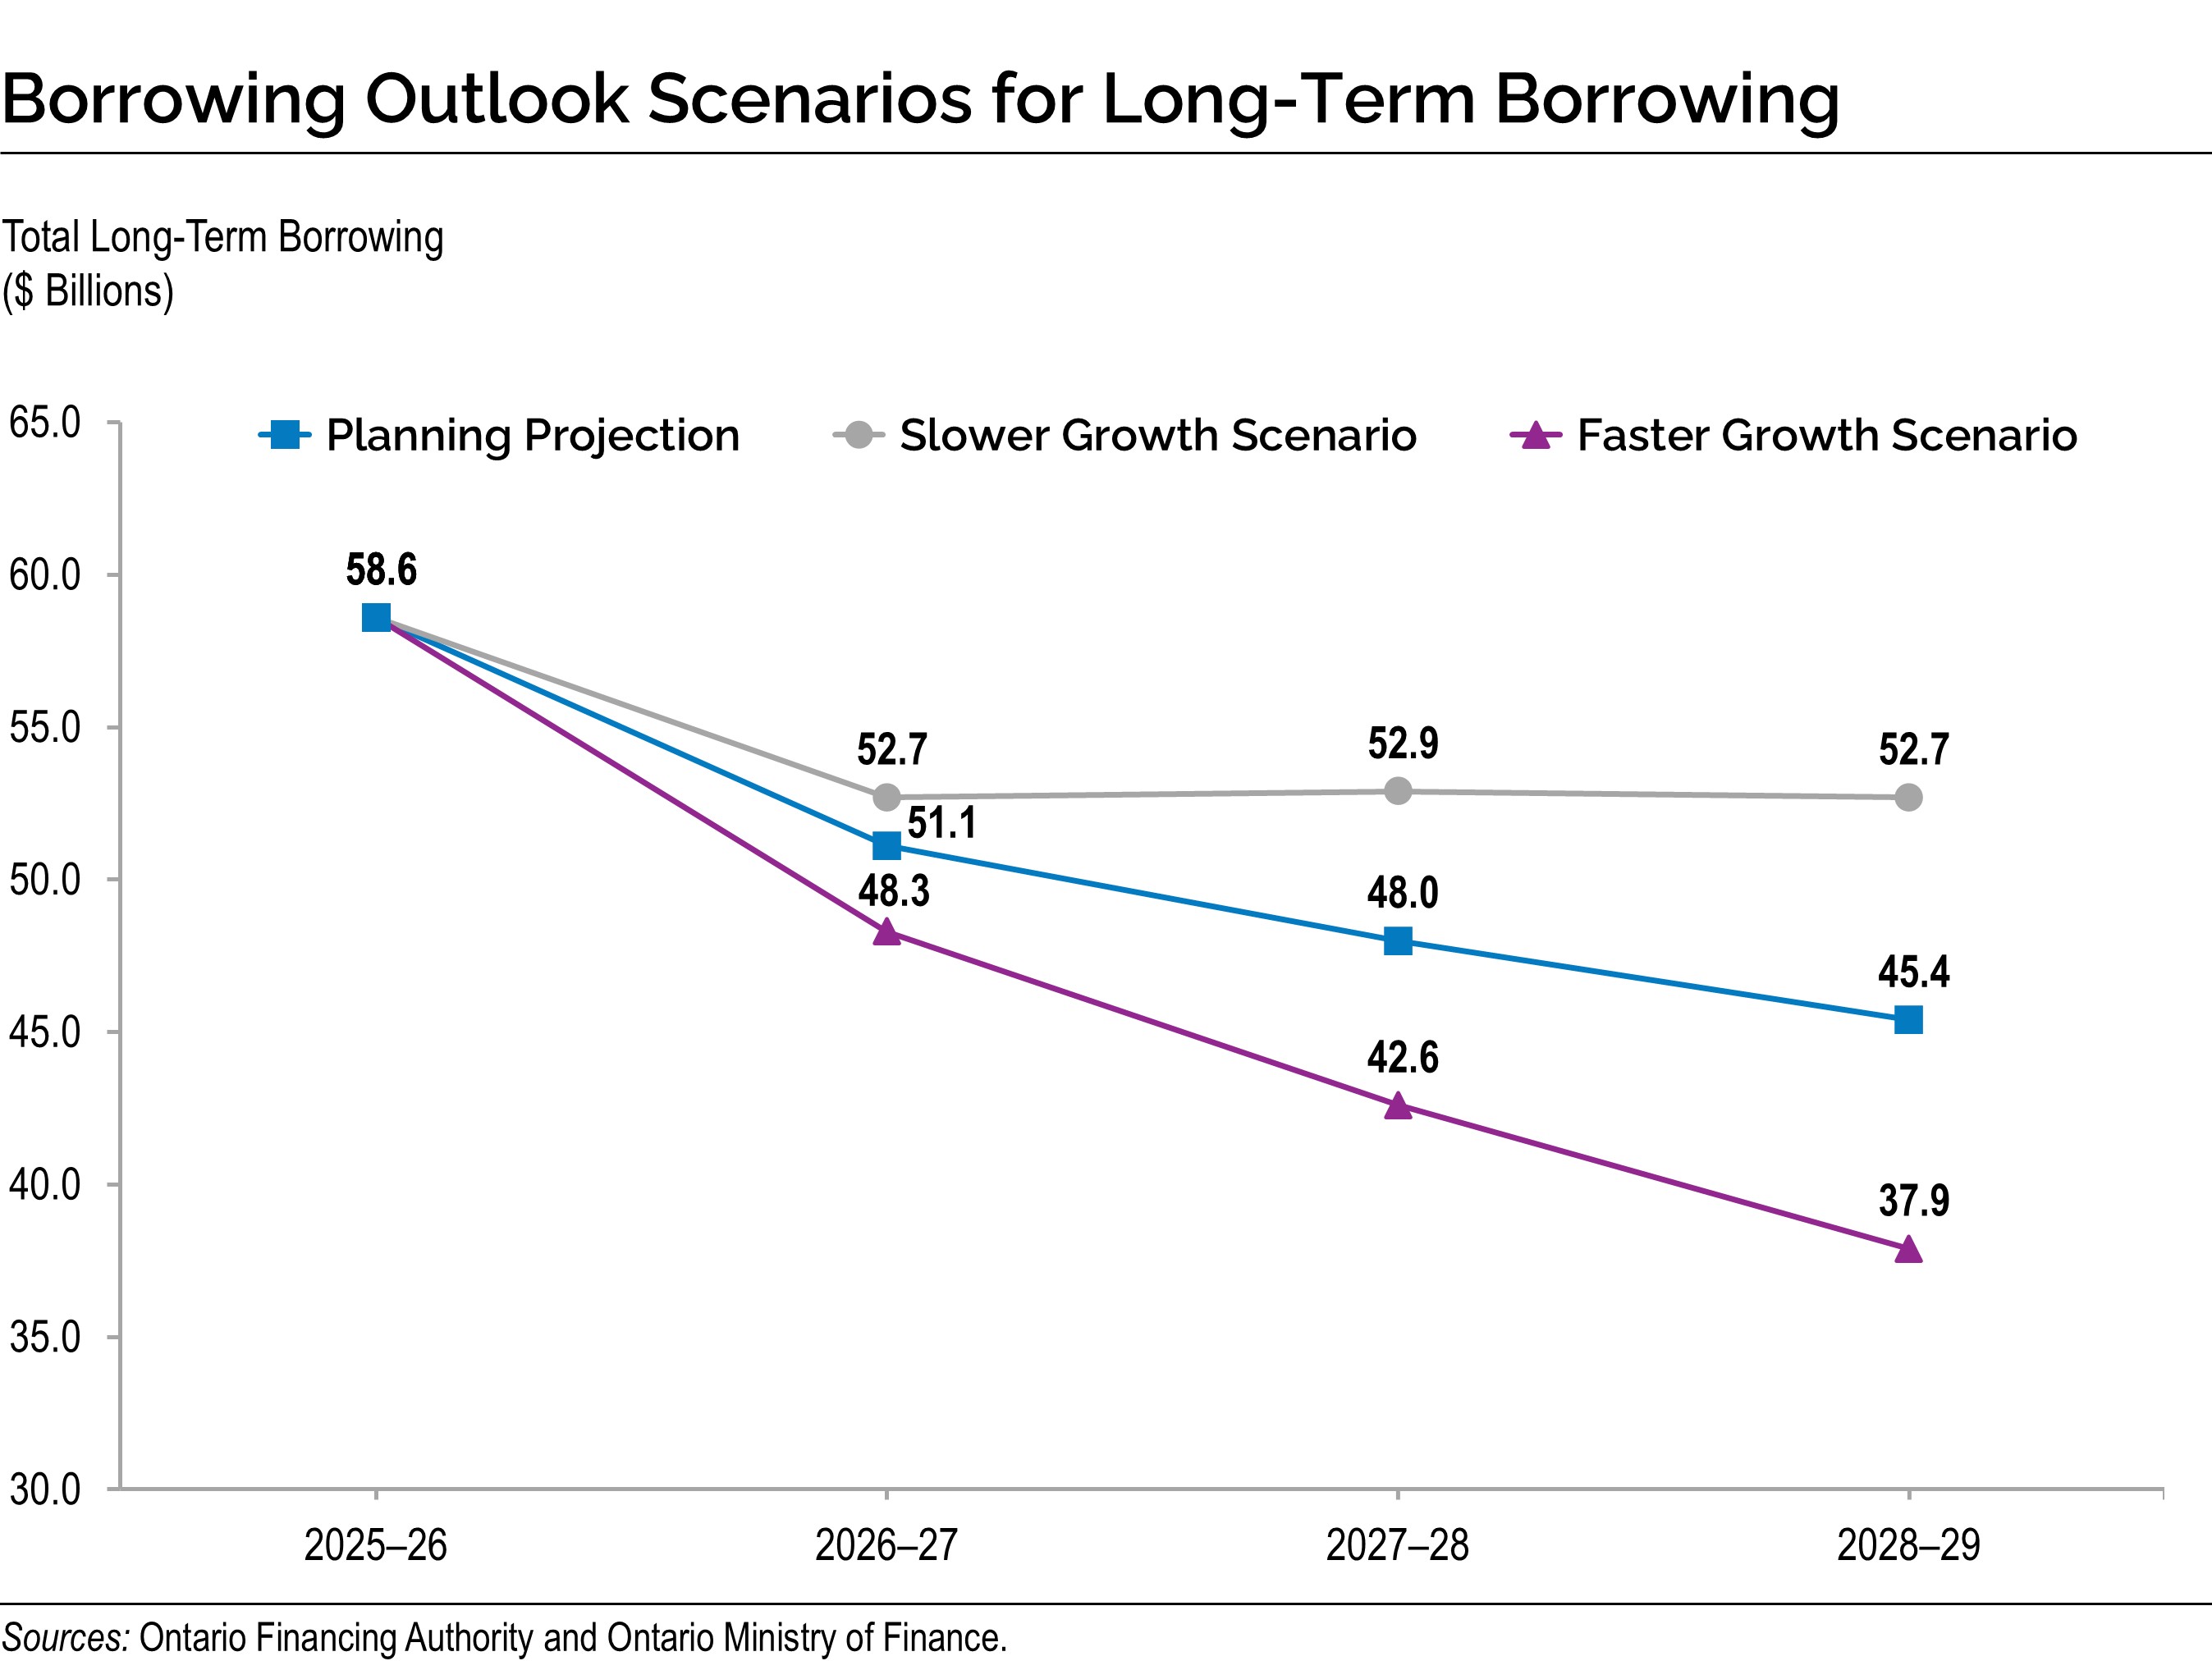
Alternative economic scenarios for faster and slower economic growth are outlined in section “Economic and Fiscal Outlook Scenarios.” Under the Faster Growth scenario, long-term borrowing would decrease by a total of $15.7 billion over the three-year outlook period, while under the Slower Growth scenario, long-term borrowing would increase by $13.8 billion over the same period.
The table below shows the progress on relevant debt sustainability measures; see Chapter 4: Borrowing and Debt Management for more details on Ontario’s debt burden reduction strategy.
| Item | Targets | 2026 Budget 2026–27 Forecast |
2026 FES 2026–27 Forecast |
|---|---|---|---|
| Net Debt-to-GDP | <40.0 | 37.7 | 37.4 |
| Net Debt-to-Revenue | <200 | 211 | 210 |
| Interest-to-Revenue | <7.5 | 6.7 | 6.7 |
Table footnotes:
Note: 2026 FES in the table is defined as the 2026 Ontario Economic Outlook and Fiscal Review.
Source: Ontario Financing Authority.
Ontario’s Capital Plan
Ontario’s capital plan continues to be the most ambitious provincial building plan in Canadian history, with planned investments over the next 10 years totalling more than $210 billion, including $37 billion in 2026–27. This plan is getting shovels in the ground to build highways, transit, hospitals, and other critical assets, laying the foundation for a stronger Ontario while creating jobs for workers.
Key highlights in the capital plan include the following:
Building Highways
Approximately $31 billion over 10 years to support the planning and construction of highway expansion and rehabilitation projects across the province, including:
- Highway 413, a new 400 series highway and transportation corridor across Halton, Peel and York regions that will support future population growth in the Greater Golden Horseshoe, bring relief to one of the busiest corridors in North America and save drivers up to 30 minutes each way on their commute;
- Highway 425, the Bradford Bypass, a new four-lane freeway connecting Highway 400 in Simcoe County and Highway 404 in York Region, which will save drivers an estimated 35 minutes in travel time;
- Accelerating construction on the all-season roads to the Ring of Fire, five years ahead of schedule, with work that commenced in June 2026 on the Webequie Supply Road and upgrades to the Anaconda and Painter Lake Roads;
- New Highway 7 expansion between Kitchener and Guelph, which includes accelerated planning and design work for a new four-lane divided highway;
- Advancing the upload of ownership and maintenance of the Gardiner Expressway and Don Valley Parkway (DVP) to the province, effective fall 2027;
- Feasibility work for a Highway 401 tunnel expressway to help relieve gridlock and improve the effectiveness of infrastructure;
- Expanding existing corridors across the province, such as Highway 11/17 between Thunder Bay and Nipigon, Highway 17 between Kenora and the Manitoba border, and Highway 69 between Parry Sound and Sudbury, to improve the movement of people and goods while supporting Northern Ontario’s mining and tourism sectors;
- Widening Highway 3 from two to four lanes between Essex and Leamington to improve road safety and keep people and goods moving in Southwestern Ontario; and
- Supporting ongoing partnerships with First Nations to build and improve highway infrastructure that will promote equity and help connect more First Nation communities to the province’s highway network.
Building Transit
Approximately $63 billion over 10 years for public transit, with a variety of projects underway, including:
- Building the largest subway expansion in Canadian history: including the Ontario Line, the Scarborough Subway Extension, the Eglinton Crosstown West Extension and the Yonge North Subway Extension, as part of the government’s plan to slash commute times across the Greater Toronto Area (GTA) and promote integrated and efficient transportation service delivery;
- Building and expanding Light Rail Transit (LRT): opening the Finch West LRT and Eglinton Crosstown LRT, advancing the Hamilton LRT and Hazel McCallion LRT construction, as well as advancing the study of the Hazel McCallion LRT extensions into downtown Brampton and Mississauga, which will provide more people with fast, affordable and reliable transit;
- Improving access to transit by constructing the East Harbour Transit Hub, which is anticipated to serve approximately 100,000 riders daily, and advancing new GO stations across Toronto, including the future Junction Triangle Station (formerly the Bloor-Lansdowne GO Station);
- Caledonia Station, now under construction; and the future Stockyards Station (formerly the St. Clair-Old Weston GO Station), where early works are underway;
- Investing nearly $1 billion to help the Toronto Transit Commission (TTC) purchase 55 new trains manufactured in Thunder Bay for Toronto’s Line 2 subway;
- Investing $850 million to refurbish GO Transit rail cars, as part of the ongoing service expansion across the GO rail network, and to support hundreds of manufacturing jobs and economic growth in Northern Ontario;
- Investing in planning to transform Niagara District Airport into a modern regional gateway, capable of supporting future commercial passenger service and runway infrastructure needed to accommodate future growth;
- Bringing back the Northlander, which will provide safe and reliable transportation options between Northern Ontario and Toronto, with new, fully accessible and state-of-the-art trains; and
- Doubling the government’s investment through the Ontario Transit Investment Fund (OTIF) to $30 million over three years, to help municipalities, Indigenous communities, and non-profits launch or grow transit services in rural and underserved areas.
Building Health Infrastructure
Investing approximately $64 billion over the next 10 years in health infrastructure, including nearly $50 billion in capital grants to support more than 50 hospital projects. These investments will add approximately 3,000 new beds over the next decade, significantly increasing access to health care across the province.
Key projects include:
- Constructing a new patient care tower at North York General Hospital, which will include over 300 beds, of which approximately 100 will be net new, plus expanded surgical facilities, support services, and a new and expanded emergency department;
- Advancing the Ottawa Hospital Civic Campus, a new 641-bed hospital that will include one of Eastern Ontario’s most advanced trauma centres, expanding access to highly specialized emergency and trauma care for patients with complex injuries and illnesses;
- Facilitating the expansion of the Scarborough Health Network (Centenary Hospital) Emergency Department, adding approximately 36,000 square feet of new emergency care space to support Scarborough’s growing population;
- Redeveloping the Lakeridge Health Bowmanville Site to expand and modernize the current hospital, adding up to 32 new beds and enhancing inpatient and ambulatory care and emergency department services;
- Replacing the existing Uxbridge Hospital with a new state-of-the-art facility on the current site, which will add patient beds and expand key services, including ambulatory care and diagnostic imaging; and
- Expanding the Timmins Emergency Department by more than 27,000 square feet, adding 29 dedicated treatment areas and a dedicated mental health emergency care space to provide access to modern emergency care and better support the growing needs of Northern communities.
Building Long-Term Care Homes
Planned investments that cumulatively total a historic $6.4 billion since 2019 remain in place to build 58,000 new and upgraded long-term care beds across the province to modern design standards. As of July 2026, over 26,000 beds (165 projects) are either open, under construction or approved to start construction, including:
- Advancing 16 long-term care homes to construction between June 2025 and June 2026, including projects supported by the new 2025 Long-Term Care Home Capital Funding Program, which provides a funding framework that better reflects regional cost variations while addressing diverse operator needs across the sector.
Building Schools and Child Care Spaces
Investing almost $30 billion over 10 years, including over $22 billion in capital grants, to build more schools and child care spaces, and support the repair and maintenance of existing schools. New schools include an English public elementary school in Kenora, an English Catholic secondary school in London, a French Catholic elementary school in Mississauga, and an addition to Earl of March Secondary School in Ottawa.
Building Postsecondary Education Infrastructure
Investing $5.5 billion in the Postsecondary Education sector over the next 10 years, including over $2.2 billion in capital grants to help colleges, universities and Indigenous Institutes make critical repairs, improve energy efficiency and modernize facilities by upgrading technology.
Building Housing-Enabling Municipal Infrastructure
Building housing-enabling municipal infrastructure, such as roads and water systems, through the Municipal Housing Infrastructure Program to support growing and developing communities.
| Sector | Current Outlook2,3 2026–27 |
Medium-Term Outlook 2027–28 |
Medium-Term Outlook 2028–29 |
10-Year Total4 |
|---|---|---|---|---|
| Transportation — Transit | 13,789 | 14,629 | 8,991 | 63,342 |
| Transportation — Provincial Highways | 5,386 | 4,073 | 3,892 | 30,687 |
| Transportation — Other Transportation, Property and Planning | 261 | 183 | 104 | 1,288 |
| Health — Hospitals | 5,602 | 8,457 | 8,354 | 62,171 |
| Health — Other Health | 1,413 | 1,249 | 929 | 9,106 |
| Education | 4,211 | 4,277 | 3,635 | 29,665 |
| Postsecondary Education — Colleges and Other | 701 | 520 | 293 | 4,045 |
| Postsecondary Education — Universities | 202 | 235 | 142 | 1,483 |
| Social | 583 | 478 | 110 | 1,811 |
| Justice | 982 | 659 | 806 | 3,935 |
| Other Sectors5 | 5,506 | 3,200 | 2,641 | 28,014 |
| Total Infrastructure Expenditures | 38,635 | 37,960 | 29,897 | 235,546 |
| Less: Other Partner Funding6 | 1,897 | 2,883 | 2,308 | 24,661 |
| Total7 | 36,739 | 35,077 | 27,588 | 210,885 |
Table footnotes:
[1] Includes interest capitalized during construction; third-party investments in hospitals, colleges and schools; federal and municipal contributions to provincially owned infrastructure investments; and transfers to municipalities, universities and non-consolidated agencies.
[2] Includes $1,261 million in interest capitalized during construction.
[3] Includes provincial investment in capital assets of $28.0 billion.
[4] Total reflects the planned infrastructure expenditures for 2026–27 through 2035–36.
[5] Includes high-speed internet infrastructure, government administration, natural resources, and culture and tourism industries.
[6] Other Partner Funding refers to third-party investments, primarily in hospitals, colleges and schools.
[7] Includes federal–municipal contributions to provincial infrastructure investments.
Note: Numbers may not add due to rounding.
Source: Ontario Treasury Board Secretariat.
Standing Up for the People of Ontario as Part of a United Team Canada
Canadians expect their governments at all levels to stand together in the face of tariffs and economic threats. Ontario will continue to work with the federal government to defend workers, businesses and communities from these unjustified tariffs and economic uncertainty.
Ontario continues to protect workers and businesses in the province impacted by the ongoing uncertainty and rising costs caused by the U.S. administration. The government also continues to deliver on its ambitious plan to build the most competitive, resilient and self-reliant economy in the G7. In advancing this important work, Ontario is counting on the federal government to join forces with the province to build a more competitive environment that attracts investments and creates good-paying jobs for Ontario workers. Federal support for businesses in key sectors, including auto and steel, as well as manufacturers of critical inputs for emerging sectors such as defence and artificial intelligence-related technology, is critical to Canada’s economic growth and sovereignty objectives. The federal government must also ensure that Ontario, which is particularly hard hit by tariffs, receives a fair share of remissions revenue from retaliatory tariffs.
Flexible, adequate, fair and sustainable federal–provincial transfers are critical to sustaining public services. Ontario acknowledges the federal government’s extension of expiring 10-year health care funding and looks forward to further discussions about long-term funding. Ontario, joined by other provinces and territories, calls on the federal government to make permanent the temporary 5 per cent minimum growth rate guarantee in the Canada Health Transfer and for long-term extensions of expiring time-limited health care funding, including funding to support mental health and addictions programs, home and community care, long-term care, and other essential programs. Failure to sustain this funding will create a fiscal cliff for provinces and territories, which would represent the biggest federal health care funding cut in a generation and put critical programs and services at risk.
Chart Descriptions
Current Fiscal Outlook Compared to the 2026 Budget
The bar chart illustrates the fiscal outlooks presented in the 2026 Budget compared to the current outlook in the 2026 Ontario Economic Outlook and Fiscal Review. The 2026 Budget projected deficits of $13.8 billion in 2026–27, $6.1 billion in 2027–28, and a surplus of $0.6 billion in 2028–29. With the release of the 2026 Ontario Economic Outlook and Fiscal Review, the projections have been revised to deficits of $16.9 billion in 2026–27, $12.7 billion in 2027–28, $6.7 billion in 2028–29, followed by a return to surplus of $0.2 billion in 2029–30 in the extended outlook.
Source: Ontario Ministry of Finance.
Comparative Cumulative Growth Rate of Public Sector Employees
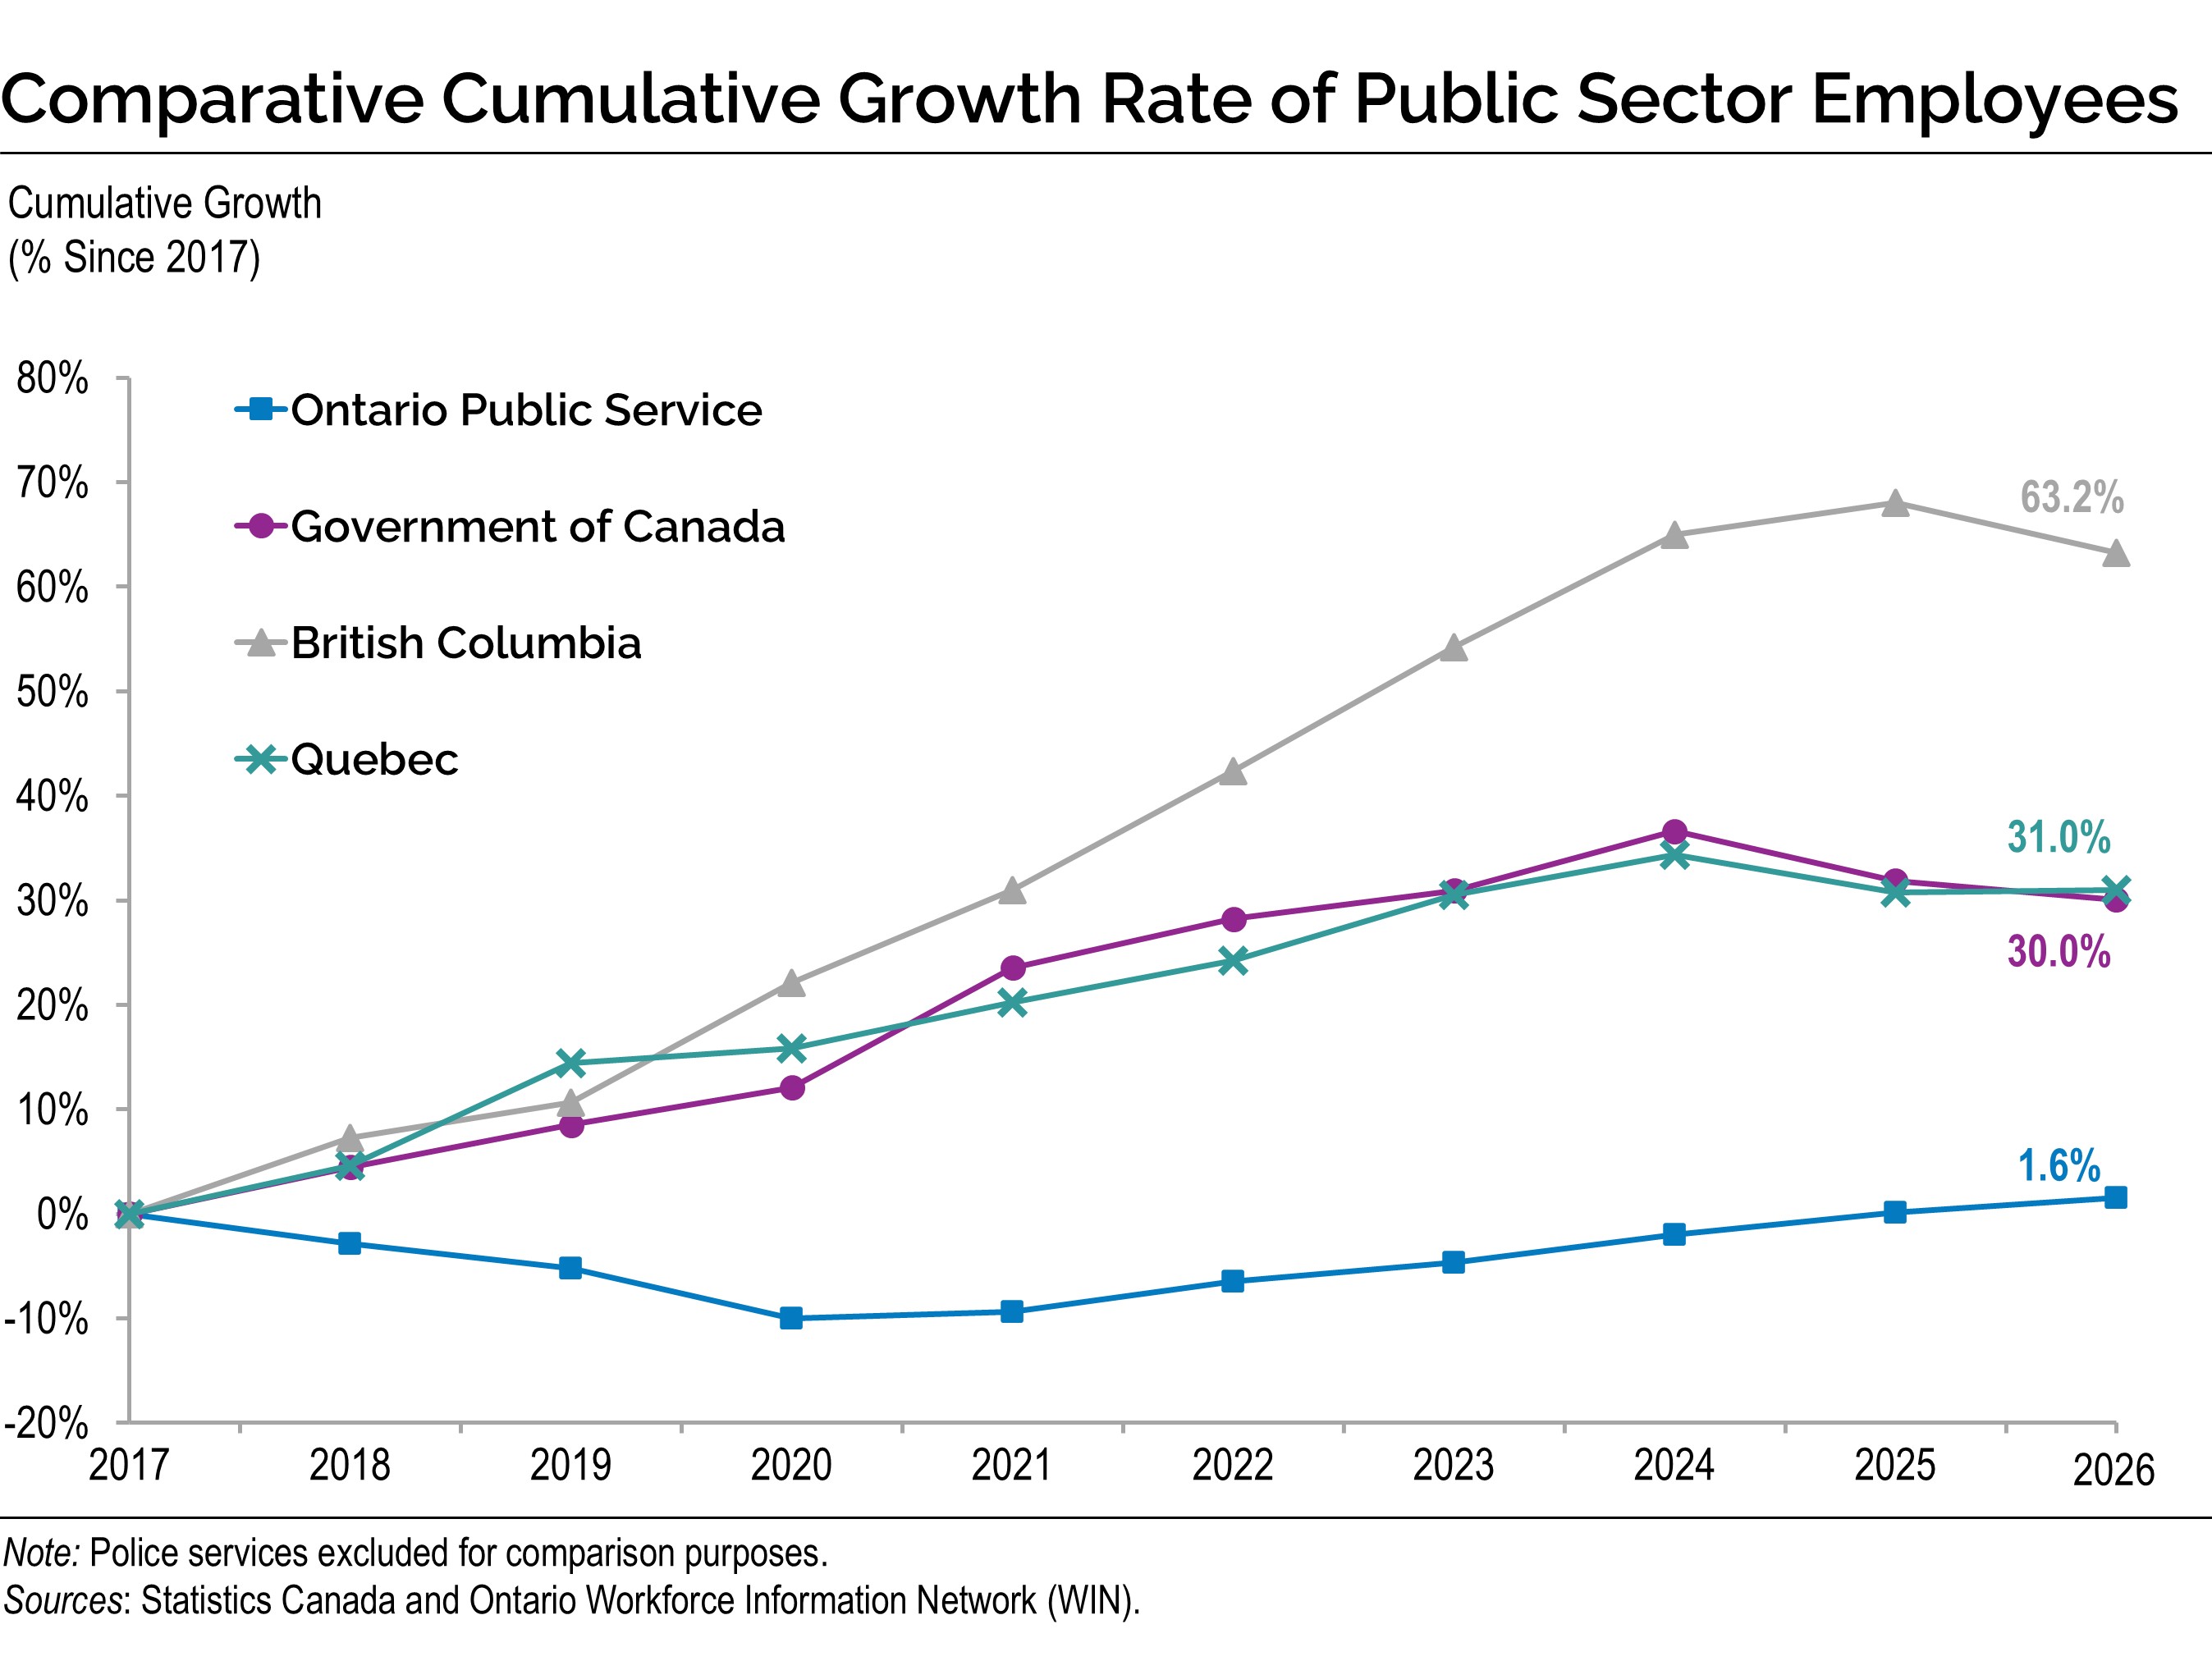
The line chart illustrates the cumulative growth since 2017 in the public service of Ontario as compared to the public services of the Government of Canada, British Columbia and Quebec. Since 2017, the Ontario Public Service has grown by 1.6 per cent. In comparison, the Government of Canada has grown by 30.0 per cent, British Columbia has grown by 63.2 per cent and Quebec has grown by 31.0 per cent.
Sources: Statistics Canada and Ontario Workforce Information Network (WIN).
Note: Police services excluded for comparison purposes.
Ontario Fiscal Outlook Scenarios
The bar chart illustrates the range of Ontario fiscal outlooks based on the two alternative economic scenarios presented in Chapter 2: Economic Performance and Outlook. The 2026 Ontario Economic Outlook and Fiscal Review estimates the deficit to be $16.9 billion in 2026–27, $12.7 billion in 2027–28, and $6.7 billion in 2028–29. Under the Faster Growth scenario, the deficit is estimated to be $14.1 billion in 2026–27 and $7.1 billion in 2027–28, before reaching a surplus of $1.3 billion in 2028–29. Under the Slower Growth scenario, the deficits are estimated to be $18.5 billion in 2026–27, $17.8 billion in 2027–28, and $14.4 billion in 2028–29.
Source: Ontario Ministry of Finance.
Borrowing Outlook Scenarios for Long-Term Borrowing
| Year | 2025–26 | 2026–27 | 2027–28 | 2028–29 |
|---|---|---|---|---|
| Planning Projection | 58.6 | 51.1 | 48.0 | 45.4 |
| Slower Growth Scenario | 58.6 | 52.7 | 52.9 | 52.7 |
| Faster Growth Scenario | 58.6 | 48.3 | 42.6 | 37.9 |
Sources: Ontario Financing Authority and Ontario Ministry of Finance.