Ontario’s Economic and Fiscal Outlook in Brief
Ontario, alongside jurisdictions around the world, continues to navigate a period of economic and geopolitical uncertainty and an evolving global landscape, as trade tensions and supply chain pressures impact the economy.
Despite these headwinds, Ontario’s economy has been resilient and performed better than expected in 2025. Real gross domestic product (GDP) is estimated to have increased by 1.2 per cent, up from 0.8 per cent at the time of the 2025 Budget.
It is more imperative than ever that the government continue to make prudent and thoughtful decisions that enable ongoing investments in key public services and the province’s long-term prosperity, while maintaining fiscal flexibility to respond to changing conditions.
In 2025–26, Ontario is projecting a deficit of $12.3 billion. Over the medium term, the government is projecting deficits of $13.8 billion in 2026–27 and $6.1 billion in 2027–28, before planning for a surplus of $0.6 billion in 2028–29, including reserve and contingencies.
The government continues to prioritize strategic investments in initiatives that protect workers and the economy from global trade tensions and put money back in people’s pockets without compromising on a path to balance.
Ontario has, and continues to implement, a plan to make Ontario the most competitive place to invest and do business in the G7 by cutting taxes, reducing red tape, streamlining permitting, removing interprovincial trade barriers, investing in infrastructure, supporting workers, improving services and making life more affordable. This is how the government is protecting Ontario.
Ontario’s Economic Outlook
Ontario’s real GDP is projected to grow by 1.0 per cent in 2026 and growth is expected to pick up in subsequent years with projected increases of 1.7 per cent in 2027, 1.8 per cent in 2028 and 2.0 per cent in 2029. For the purposes of prudent fiscal planning, these projections are set slightly below the average of private‐sector forecasts.
| Item | 2025 | 2026p | 2027p | 2028p | 2029p |
|---|---|---|---|---|---|
| Real GDP Growth | 1.2e | 1.0 | 1.7 | 1.8 | 2.0 |
| Nominal GDP Growth | 4.2e | 3.2 | 3.9 | 3.7 | 3.9 |
| Employment Growth | 1.0 | 0.5 | 0.7 | 0.8 | 1.1 |
| CPI Inflation | 1.9 | 2.1 | 2.0 | 2.0 | 2.0 |
Table footnotes:
e = estimate.
p = Ontario Ministry of Finance planning projection based on external sources as of January 16, 2026.
Sources: Statistics Canada and Ontario Ministry of Finance.
Revisions to the Economic Outlook Since the 2025 Budget
The outlook has been revised compared to the projections in the 2025 Budget. Key changes since the 2025 Budget include:
- Stronger nominal GDP growth in 2025 and 2026;
- Stronger growth in compensation of employees and net operating surplus in 2025;
- Stronger job creation in 2025 and 2026; and
- Slower growth in home resales in 2025 and 2026.
| Item | 2025 2025 Budget |
2025 2026 Budget |
2026p 2025 Budget |
2026p 2026 Budget |
2027p 2025 Budget |
2027p 2026 Budget |
2028p 2025 Budget |
2028p 2026 Budget |
|---|---|---|---|---|---|---|---|---|
| Real Gross Domestic Product | 0.8 | 1.2e | 1.0 | 1.0 | 1.9 | 1.7 | 1.9 | 1.8 |
| Nominal Gross Domestic Product | 3.1 | 4.2e | 3.0 | 3.2 | 4.0 | 3.9 | 4.0 | 3.7 |
| Compensation of Employees | 3.7 | 4.0e | 3.2 | 3.2 | 3.6 | 3.3 | 3.8 | 3.5 |
| Net Operating Surplus — Corporations | (3.0) | 4.4e | 6.4 | 4.7 | 7.2 | 7.2 | 5.2 | 6.1 |
| Nominal Household Consumption | 3.5 | 4.0e | 3.1 | 3.3 | 3.7 | 3.4 | 3.8 | 3.6 |
| Other Economic Indicators — Employment | 0.9 | 1.0 | 0.4 | 0.5 | 0.9 | 0.7 | 0.9 | 0.8 |
| Other Economic Indicators — Job Creation (000s) | 73 | 81 | 33 | 41 | 74 | 58 | 75 | 67 |
| Other Economic Indicators — Unemployment Rate (Per Cent) | 7.6 | 7.7 | 7.3 | 7.4 | 6.6 | 6.9 | 6.2 | 6.4 |
| Other Economic Indicators — Consumer Price Index | 2.3 | 1.9 | 2.0 | 2.1 | 2.0 | 2.0 | 2.0 | 2.0 |
| Other Economic Indicators — Housing Starts (000s)1 | 71.8 | 65.4 | 74.8 | 64.8 | 82.5 | 70.3 | 85.9 | 76.8 |
| Other Economic Indicators — Home Resales | 5.3 | (5.6) | 12.7 | 9.1 | 4.6 | 5.6 | 1.5 | 4.6 |
| Other Economic Indicators — Home Resale Prices | (1.2) | (4.4) | 2.6 | 0.8 | 3.8 | 2.7 | 4.0 | 4.2 |
| Key External Variables — U.S. Real Gross Domestic Product | 1.4 | 2.2 | 1.4 | 2.4 | 2.0 | 2.1 | 2.0 | 2.0 |
| Key External Variables — WTI Crude Oil ($US per Barrel) | 69 | 65 | 69 | 59 | 74 | 62 | 75 | 67 |
| Key External Variables — Canadian Dollar (Cents US) | 69.2 | 71.6 | 71.2 | 73.2 | 73.0 | 75.3 | 74.1 | 76.4 |
| Key External Variables — Three-Month Treasury Bill Rate (Per Cent)2 | 2.4 | 2.6 | 2.3 | 2.3 | 2.4 | 2.6 | 2.6 | 2.5 |
| Key External Variables — 10-Year Government Bond Rate (Per Cent)3 | 3.1 | 3.2 | 3.2 | 3.3 | 3.4 | 3.5 | 3.5 | 3.5 |
Table footnotes:
e = estimate.
p = Ontario Ministry of Finance planning projection based on external sources as of January 16, 2026.
[1] Housing starts projection based on private-sector average as of January 16, 2026.
[2], [3] Government of Canada interest rates.
Sources: Statistics Canada; Canada Mortgage and Housing Corporation; Canadian Real Estate Association; Bank of Canada; United States Bureau of Economic Analysis; Blue Chip Economic Indicators (February 2026 and October 2025); U.S. Energy Information Administration; and Ontario Ministry of Finance.
Managing Ontario’s Finances Responsibly
The government’s plan is consistent with the Fiscal Sustainability, Transparency and Accountability Act, 2019 and its governing principles that guide Ontario’s fiscal policy.
- Transparent: The government continues to be transparent through the release of regular fiscal updates. This is the eighth year in a row that the government has received a clean audit opinion from Ontario’s Auditor General.
- Responsible: The government has developed a measured and accountable approach to managing Ontario’s finances, while investing in key public services and capital projects.
- Flexible: The government’s plan has built in appropriate levels of prudence in the form of contingency funds and a reserve to ensure the necessary fiscal flexibility is available to respond to changing circumstances.
- Equitable: The government’s plan sustains investments in key public services, such as health care, social services and education, ensuring that these services are readily available for the people of today and maintained for the benefit of future generations.
- Sustainable: The government remains committed to achieving a balanced budget and reducing the province’s debt burden to ensure the long-term sustainability of Ontario’s finances.
Ontario remains committed to responsible borrowing and debt management. Over the medium-term outlook, the net debt-to-GDP ratio is forecast to stay below the province’s target of 40.0 per cent, demonstrating that Ontario continues to make positive progress towards reducing the debt burden. Ontario’s interest-to-revenue ratio is projected to be 6.3 per cent in 2025–26, 0.2 percentage points lower than the 6.5 per cent forecasted in the 2025 Budget. This ratio remains close to the lowest levels it has been at since the 1980s.
Ontario’s strong credit ratings, fiscal profile and professional approach to markets have contributed to unprecedented global investor demand for the province’s debt. Increased international demand has resulted in increased foreign issuance, allowing for further diversification of Ontario’s investor base while reducing overall borrowing costs. For example, this year, for the first time, Ontario issued euro denominated 30-year bonds, raising $0.6 billion at lower costs than issuing in Canada after being hedged back to Canadian dollars.
In response to global economic challenges, Ontario has continued the prudent management of its finances to build a more resilient, self-reliant economy and secure long-term prosperity. The government will continue to rise to these challenges by pursuing opportunities to modernize programs, reduce bureaucracy and administrative costs and ensure that services are provided in the most efficient and cost-effective way possible. This will help ensure that Ontario has the fiscal capacity to deliver better front-line services for those who need them most, and that it can invest in strategic priorities to unleash the economy. See section entitled “Strengthening Public Services for a Sustainable and Prosperous Future” in Chapter 1: Protect Ontario’s Public Services for more details.
Ontario’s Fiscal Plan
In 2026–27, the government is projecting a deficit of $13.8 billion, improving to a deficit of $6.1 billion in 2027–28 and a surplus of $0.6 billion in 2028–29. This outlook is driven by investments to grow Ontario’s economy and protect critical public services such as health care, education and infrastructure.
| Item | Actual 2024–25 |
Interim 2025–26 |
Medium-Term Outlook 2026–27 |
Medium-Term Outlook 2027–28 |
Medium-Term Outlook 2028–29 |
|---|---|---|---|---|---|
| Revenue — Personal Income Tax | 55.7 | 61.9 | 65.1 | 69.5 | 74.1 |
| Revenue — Sales Tax | 39.4 | 39.2 | 39.9 | 43.2 | 45.1 |
| Revenue — Corporations Tax | 27.8 | 27.6 | 28.6 | 30.6 | 32.5 |
| Revenue — Ontario Health Premium | 5.2 | 5.2 | 5.5 | 5.7 | 5.9 |
| Revenue — Education Property Tax | 5.9 | 5.9 | 6.0 | 6.0 | 6.1 |
| Revenue — All Other Taxes | 17.6 | 18.0 | 18.5 | 19.1 | 20.1 |
| Total Taxation Revenue | 151.5 | 158.0 | 163.6 | 174.1 | 183.8 |
| Government of Canada Transfers | 36.6 | 39.1 | 39.8 | 40.1 | 40.4 |
| Income from Government Business Enterprises | 7.5 | 7.3 | 6.5 | 6.8 | 7.3 |
| Other Non-Tax Revenue | 30.5 | 22.2 | 21.9 | 22.4 | 22.6 |
| Total Revenue | 226.2 | 226.6 | 231.9 | 243.4 | 254.1 |
| Programs — Health Sector | 91.3 | 97.8 | 101.2 | 103.5 | 106.7 |
| Programs — Education Sector1 | 38.3 | 40.5 | 40.8 | 41.2 | 41.5 |
| Programs — Postsecondary Education Sector | 14.2 | 14.0 | 14.0 | 12.8 | 12.7 |
| Programs — Children, Community and Social Services Sector | 20.5 | 21.5 | 21.4 | 21.6 | 21.7 |
| Programs — Justice Sector | 7.2 | 7.3 | 7.3 | 7.3 | 7.4 |
| Programs — Other Programs | 40.6 | 41.2 | 42.4 | 42.5 | 41.3 |
| Total Programs | 212.1 | 222.4 | 227.0 | 229.0 | 231.3 |
| Interest and Other Debt Servicing Charges | 15.1 | 16.0 | 17.2 | 18.6 | 19.7 |
| Total Expense | 227.3 | 238.4 | 244.2 | 247.5 | 251.1 |
| Surplus/(Deficit) Before Reserve | (1.1) | (11.8) | (12.3) | (4.1) | 3.1 |
| Reserve | – | 0.5 | 1.5 | 2.0 | 2.5 |
| Surplus/(Deficit) | (1.1) | (12.3) | (13.8) | (6.1) | 0.6 |
| Net Debt as a Per Cent of GDP2 | 35.7% | 36.8% | 37.7% | 38.5% | 38.2% |
| Net Debt as a Per Cent of Revenue3 | 191.2% | 204.4% | 210.9% | 212.9% | 209.8% |
| Interest as a Per Cent of Revenue | 5.5% | 6.3% | 6.7% | 6.9% | 7.1% |
Table footnotes:
[1] Excludes Teachers’ Pension Plan. Teachers’ Pension Plan expense is included in Other Programs.
[2], [3] For 2026–27 and future years, Net Debt reflects financial assets less financial liabilities and is aligned with Net Financial Liabilities, as will be reported in the Public Accounts of Ontario 2026–2027. See the Debt Burden Reduction Strategy in Chapter 4: Borrowing and Debt Management for additional details on the calculations supporting the ratios.
Note: Numbers may not add due to rounding.
Sources: Ontario Treasury Board Secretariat and Ontario Ministry of Finance.
Revenue Outlook Over the Medium Term
Ontario’s revenue outlook is forecast to increase from $226.2 billion in 2024–25 to $254.1 billion in 2028–29.
Ontario’s revenue outlook is anchored by an economic projection based on private-sector forecasts and the best available information at the time of finalizing the planning projection. Details of the medium-term revenue outlook are outlined in Chapter 3: Ontario’s Fiscal Plan and Outlook.
Key inputs included in the revenue forecast are: a prudent economic outlook, existing federal–provincial agreements and funding formulas and the business plans of government ministries, business enterprises and service organizations.
Program Expense Outlook Over the Medium Term
Ontario’s program expense outlook is expected to grow from $212.1 billion in 2024–25 to $231.3 billion in 2028–29. The additional funding will primarily be used to protect Ontario’s economy and its workers, improving affordability and strengthening investments in critical public services such as health, education and infrastructure. In addition, contingencies have been incorporated into the program expense outlook to ensure fiscal stability and the ability to respond to unforeseen events.
See Chapter 3: Ontario’s Fiscal Plan and Outlook for further details on the program expense outlook over the medium term.
Interest and Other Debt Servicing Charges Outlook Over the Medium Term
Interest and Other Debt Servicing Charges (IOD) is forecast to be $16.0 billion in 2025–26, down from the 2025 Budget forecast of $16.2 billion. Over the medium-term outlook, IOD is forecast to be $17.2 billion in 2026–27, $18.6 billion in 2027–28 and $19.7 billion in 2028–29.
Other Fiscal Plan Assumptions
The reserve is set at $1.5 billion in 2026–27, $2.0 billion in 2027–28 and $2.5 billion in 2028–29, reflecting Ontario’s commitment to maintaining a prudent and flexible fiscal plan. These reserve levels are among the highest allocated in any Ontario Budget.
The net debt-to-GDP ratio is projected to be 37.7 per cent in 2026–27, 38.5 per cent in 2027–28 and declining to 38.2 per cent in 2028–29.
Economic and Fiscal Outlook Scenarios
To provide more transparency about the province’s economic outlook amid the elevated degree of economic uncertainty, the Ontario Ministry of Finance has developed Faster Growth and Slower Growth scenarios that could impact the economy over the next few years. These alternative scenarios should not be considered the best case or the worst case, but reasonable possible outcomes in this period of uncertainty. See Chapter 2: Economic Performance and Outlook for more details.
| Item | 2026p | 2027p | 2028p | 2029p |
|---|---|---|---|---|
| Faster Growth Scenario | 1.6 | 2.2 | 1.9 | 2.1 |
| Planning Projection | 1.0 | 1.7 | 1.8 | 2.0 |
| Slower Growth Scenario | 0.3 | 0.6 | 1.8 | 2.0 |
Table footnotes:
p = Ontario Ministry of Finance planning projection based on external sources as of January 16, 2026, and alternative scenarios.
Source: Ontario Ministry of Finance.
| Item | 2026p | 2027p | 2028p | 2029p |
|---|---|---|---|---|
| Faster Growth Scenario | 4.0 | 4.6 | 4.0 | 4.2 |
| Planning Projection | 3.2 | 3.9 | 3.7 | 3.9 |
| Slower Growth Scenario | 2.3 | 2.6 | 3.5 | 3.7 |
Table footnotes:
p = Ontario Ministry of Finance planning projection based on external sources as of January 16, 2026, and alternative scenarios.
Source: Ontario Ministry of Finance.
If either of the alternative economic scenarios were to materialize versus the Planning Projection, Ontario’s fiscal plan would also change as a result.
Based on the two alternative nominal GDP growth economic scenarios, two taxation revenue outlook scenarios were developed.
| Item | 2026–27p | 2027–28p | 2028–29p |
|---|---|---|---|
| Faster Growth Scenario | 166.2 | 179.4 | 191.3 |
| Planning Projection | 163.6 | 174.1 | 183.8 |
| Slower Growth Scenario | 160.9 | 167.8 | 175.5 |
Table footnotes:
p = Ontario Ministry of Finance planning projection based on external sources as of January 16, 2026, and alternative scenarios.
Note: Numbers may not add due to rounding.
Source: Ontario Ministry of Finance.
Under the Faster Growth scenario, total taxation revenue over the medium term is $7.4 billion higher than the Planning Projection in 2028–29; under the Slower Growth scenario, total taxation revenue is $8.3 billion lower.
Under the Faster Growth scenario, the deficit outlook may improve to $11.2 billion in 2026–27, $0.7 billion in 2027–28 and a surplus of $8.5 billion in 2028–29. However, if the Slower Growth scenario materializes instead, the deficit outlook may deteriorate to $16.6 billion in 2026–27, $12.7 billion in 2027–28 and $8.3 billion in 2028–29.
Borrowing and Debt Management
Ontario’s borrowing program is primarily used to fund deficits, refinance maturing debt, make investments in capital assets and support other loans and investments that advance key provincial priorities. Ontario will continue to finance most of its borrowing program in the long-term public markets in Canada, as well as internationally. Ontario completed long-term public borrowing of $58.6 billion for 2025–26. The total long-term borrowing requirements for 2026–27, 2027–28 and 2028–29 are forecast to be $47.2 billion, $43.1 billion and $42.7 billion, respectively. Ontario’s borrowing program is partly driven by a historic capital plan.
| Item | 2025–26: 2025 Budget |
2025–26: Change from 2025 Budget |
2025–26: Interim 2025–26 |
Medium-Term Outlook 2026–27 |
Medium-Term Outlook 2027–28 |
Medium-Term Outlook 2028–29 |
|---|---|---|---|---|---|---|
| Deficit/(Surplus) | 14.6 | (2.3) | 12.3 | 13.8 | 6.1 | (0.6) |
| Provincial Investment in Capital Assets | 23.1 | 1.3 | 24.4 | 28.0 | 28.0 | 22.4 |
| Pre-funding for Protect Ontario Account | – | 5.0 | 5.0 | – | – | – |
| Amortization of Capital Assets | (9.1) | – | (9.1) | (10.2) | (10.5) | (11.4) |
| Non-Cash and Cash Timing Adjustments | (3.1) | 1.0 | (2.1) | (2.5) | (2.7) | (3.5) |
| Net Loans and Investments1 | 1.2 | 1.1 | 2.4 | 5.2 | 5.6 | 4.9 |
| Debt Maturities and Redemptions | 33.1 | – | 33.1 | 26.9 | 27.5 | 30.7 |
| Total Funding Requirement | 59.8 | 6.1 | 65.9 | 61.2 | 54.1 | 42.7 |
| Decrease/(Increase) in Short-Term Borrowing | (5.0) | (0.5) | (5.5) | (6.0) | (6.0) | – |
| Increase/(Decrease) in Year-End Cash and Cash Equivalents | (12.0) | 10.2 | (1.8) | (8.0) | (5.0) | – |
| Total Long-Term Borrowing | 42.8 | 15.8 | 58.6 | 47.2 | 43.1 | 42.7 |
Table footnotes:
[1] The increase in Net Loans and Investments primarily reflects higher projected loan disbursements associated with Ontario Student Assistance Program (OSAP) policy changes effective in the 2026–27 academic year.
Note: Numbers may not add due to rounding.
Source: Ontario Financing Authority.
Ontario is projected to pay $16.0 billion in IOD in 2025–26, $17.2 billion in 2026–27, $18.6 billion in 2027–28 and $19.7 billion in 2028–29.
As a share of revenue, IOD is projected to remain near record lows in 2025–26. A one percentage point change in interest rates either up or down from the current interest rate is estimated to have a corresponding change in Ontario’s borrowing costs by around $0.9 billion in the first full year.
The net debt-to-GDP ratio in 2025–26 is now projected to be 36.8 per cent, or 1.1 percentage points lower than the 37.9 per cent forecast in the 2025 Budget, which is mainly due to a lower than previously projected deficit. Over the medium-term outlook, the net debt-to-GDP ratio is projected to remain modestly lower than the forecasts provided in the 2025 Budget and continues to remain below target levels. The table below shows the progress that has been made on relevant debt sustainability measures; see Chapter 4: Borrowing and Debt Management for more details on Ontario’s debt burden reduction strategy.
| Item | Targets | 2025–26 Forecast 2025 Budget |
2025–26 Forecast 2026 Budget |
2026–27 Forecast 2025 Budget |
2026–27 Forecast 2026 Budget |
|---|---|---|---|---|---|
| Net Debt-to-GDP1 | <40.0 | 37.9 | 36.8 | 38.9 | 37.7 |
| Net Debt-to-Revenue2 | <200 | 211 | 204 | 215 | 211 |
| Interest-to-Revenue | <7.5 | 6.5 | 6.3 | 6.7 | 6.7 |
Table footnotes:
[1], [2] For 2026–27 and future years, Net Debt reflects financial assets less financial liabilities and is aligned with Net Financial Liabilities, as will be reported in the Public Accounts of Ontario 2026–2027. See the Debt Burden Reduction Strategy in Chapter 4: Borrowing and Debt Management for additional details on the calculations supporting the ratios.
Source: Ontario Financing Authority.
Ontario’s Capital Plan
Ontario’s capital plan continues to be the most ambitious provincial plan to build in Canadian history, with planned investments over the next 10 years totalling more than $210 billion, including $37 billion in 2026–27. This plan is getting shovels in the ground to build highways, transit, hospitals and other critical assets, laying the foundation for a better Ontario while creating jobs for workers on construction sites.
Key highlights in the capital plan include the following:
Building Highways
Approximately $31 billion over 10 years to support the planning and construction of highway expansion and rehabilitation projects across the province, including:
- Highway 413, a new 400-series highway and transportation corridor across Halton, Peel and York regions that will support future population growth in the Greater Golden Horseshoe, bring relief to one of the busiest corridors in North America and save drivers up to 30 minutes each way on their commute;
- Bradford Bypass, a new four-lane freeway connecting Highway 400 in Simcoe County and Highway 404 in York Region, which will save drivers an estimated 35 minutes in travel time;
- Feasibility work for a Highway 401 tunnel expressway to help relieve gridlock and improve the effectiveness of infrastructure, with fieldwork starting this spring;
- Accelerating construction on the all-season roads to the Ring of Fire, with construction planned to start in June 2026 and roads beginning to open in November 2030, five years ahead of schedule;
- Queen Elizabeth Way (QEW) Garden City Skyway Bridge Twinning project, which includes construction of a new bridge on the QEW over the Welland Canal, connecting the City of St. Catharines to the Town of Niagara-on-the-Lake;
- New Highway 7 expansion between Kitchener and Guelph, which includes planning and design work for widening the roadway from two to four lanes;
- Enhancing Highway 401 to improve safety and traffic flow, and support economic development through resurfacing, bridge replacements and repairs, interchange improvements and ramp upgrades across the province;
- Widening existing corridors across the province, such as Highway 11/17 between Thunder Bay and Nipigon and Highway 17 between Kenora and the Manitoba border;
- Supporting planning and design for a new interchange connecting Highway 401 to the future Lauzon Parkway extension in Windsor, which will support increased opportunities for trade and improved access to the Windsor–Detroit border;
- Continuing progress on due diligence for the Gardiner Expressway and Don Valley Parkway, while providing ongoing support to repair and rehabilitate the Gardiner Expressway;
- Providing funding for the maintenance and rehabilitation of Ottawa Road 174 while due diligence is underway;
- Widening Highway 69 from two to four lanes between Parry Sound and Sudbury;
- Widening Highway 3 from two to four lanes between Essex and Leamington to improve road safety and keep people and goods moving in Southwestern Ontario; and
- Supporting renewed partnerships with First Nations to build and improve highway infrastructure that will promote equity and help connect more First Nation communities to the province’s highway network.
Building Transit
Approximately $63 billion over 10 years for public transit, with a variety of projects underway, including:
- Building the largest subway expansion in Canadian history: the Ontario Line, the Scarborough Subway Extension, the Eglinton Crosstown West Extension and the Yonge North Subway Extension, as part of the government’s plan to slash commute times across the Greater Toronto Area (GTA) and promote integrated and efficient transportation service delivery;
- Building and expanding Light Rail Transit (LRT): opening the Finch West LRT and Eglinton Crosstown LRT, as well as advancing the Hamilton LRT and Hazel McCallion Line into downtown Brampton and Mississauga, with plans to tunnel the Brampton portion of the line, which will provide more people with fast, affordable and reliable transit;
- Investing nearly $1 billion to help the Toronto Transit Commission (TTC) purchase 55 new trains manufactured in Thunder Bay for Toronto’s Line 2 subway;
- Investing $850 million to refurbish GO Transit rail cars, as part of the ongoing service expansion across the GO rail network, and to support hundreds of manufacturing jobs and economic growth in Northern Ontario;
- Bringing back the Northlander in 2026, which will provide safe and reliable transportation options between Northern Ontario and Toronto, with new, fully accessible and state-of-the-art trains; and
- Constructing the East Harbour Transit Hub, which is anticipated to serve approximately 100,000 riders daily while substantially reducing crowding at Union Station.
Building Health Infrastructure
Approximately $64 billion over the next 10 years in health infrastructure, including nearly $50 billion in capital grants, to support more than 50 major hospital projects that would add approximately 3,000 new beds over 10 years to increase access to quality care. Investments are being made to support hospital projects, including:
- Investing in the new Fancsy Family Hospital project to consolidate acute care services from two hospitals into one site with a capacity of 594 beds (including 101 net new beds), to relieve system pressures in Windsor and Essex County;
- Supporting the Peter Gilgan Mississauga Hospital, to build the largest teaching hospital in Canada, tripling the size of the existing hospital to help provide health care to an estimated 2.2 million people;
- Investing in the Ottawa Hospital to build a state-of-the-art Civic Campus, which will serve as the lead acute care centre for Ottawa and Eastern Ontario;
- Funding to support the planning of a new Orillia Soldiers’ Memorial Hospital, which will connect more families in Orillia and its surrounding communities to more convenient, high-quality care close to home;
- Supporting the construction of Phase One of Stevenson Memorial Hospital’s redevelopment, which will include construction of a new, three-storey building that will more than double the size of the hospital;
- Supporting the construction of the new South Niagara Hospital which, once completed in summer 2028, will include 469 beds and expand 24/7 emergency, diagnostic, surgical, and therapeutic services for patients and families across the region;
- Advancing work on Lakeridge Health’s Bowmanville Hospital redevelopment, which will more than double the hospital’s capacity by adding up to 32 new beds and expanding inpatient and ambulatory care services and the emergency department; and
- Advancing work on William Osler Health System’s Peel Memorial Hospital Phase 2 redevelopment, which includes construction of a new, 12-storey tower to accommodate non-acute inpatient services, including space for up to 250 new post-acute inpatient beds, a 24/7 emergency care centre, inpatient and outpatient dialysis and expanded ambulatory and non-acute services.
Building Long-Term Care
Planned investments that total a historic $6.4 billion since 2019 are in place to build 58,000 new and upgraded long-term care beds across the province by 2028 to modern design standards. As of February 2026, nearly 26,000 beds (164 projects) are either open, under construction or approved to start construction, including:
- Eleven long-term care homes that have advanced to construction between June 2025 and February 2026, including projects supported by the new 2025 Capital Funding Program, which provides a funding framework that better reflects regional cost variations while addressing diverse operator needs across the sector.
Building Schools and Child Care Spaces
- Investing about $30 billion over the next 10 years, including over $22 billion in capital grants, to build more schools and child care spaces, including a new English public elementary school in Savant Lake, a new French Catholic elementary school in Orléans, a new English Catholic elementary and secondary school in Kitchener, a new French public elementary school in North York and an addition to Holy Trinity Catholic High School in Bradford West Gwillimbury.
Building Postsecondary Education Infrastructure
- Investing $5.5 billion in the Postsecondary Education sector over the next 10 years, including over $2.2 billion in capital grants to help colleges, universities and Indigenous Institutes make critical repairs, improve energy efficiency and modernize facilities by upgrading technology.
Building Housing-Enabling Municipal Infrastructure
- Building housing-enabling municipal infrastructure projects, such as roads and water systems, through the Municipal Housing Infrastructure Program to support growing and developing communities.
| Sector | Interim2 2025–26 |
Medium-Term Outlook 2026–27 |
Medium-Term Outlook 2027–28 |
Medium-Term Outlook 2028–29 |
10-Year Total3 |
|---|---|---|---|---|---|
| Transportation — Transit | 12,714 | 13,789 | 14,629 | 8,991 | 63,342 |
| Transportation — Provincial Highways | 4,128 | 5,391 | 4,073 | 3,892 | 30,693 |
| Transportation — Other Transportation, Property and Planning | 225 | 261 | 183 | 104 | 1,288 |
| Health — Hospitals | 4,458 | 5,602 | 8,457 | 8,354 | 62,171 |
| Health — Other Health | 645 | 1,413 | 1,249 | 929 | 9,106 |
| Education | 4,213 | 4,211 | 4,277 | 3,635 | 29,665 |
| Postsecondary Education — Colleges and Other | 831 | 701 | 520 | 293 | 4,045 |
| Postsecondary Education — Universities | 213 | 202 | 235 | 142 | 1,483 |
| Social | 601 | 583 | 478 | 110 | 1,811 |
| Justice | 629 | 1,102 | 659 | 806 | 4,055 |
| Other Sectors4 | 6,041 | 5,386 | 3,200 | 2,641 | 27,893 |
| Total Infrastructure Expenditures | 34,695 | 38,641 | 37,960 | 29,897 | 235,552 |
| Less: Other Partner Funding5 | 2,416 | 1,897 | 2,883 | 2,308 | 24,661 |
| Total6 | 32,279 | 36,744 | 35,077 | 27,588 | 210,890 |
Table footnotes:
[1] Includes interest capitalized during construction; third-party investments in hospitals, colleges and schools; federal and municipal contributions to provincially owned infrastructure investments; and transfers to municipalities, universities and non-consolidated agencies.
[2] Includes provincial investment in capital assets of $24.4 billion.
[3] Total reflects the planned infrastructure expenditures for years 2026–27 through 2035–36.
[4] Includes high-speed internet infrastructure, government administration, natural resources and culture and tourism industries.
[5] Other Partner Funding refers to third-party investments primarily in hospitals, colleges and schools.
[6] Includes federal/municipal contributions to provincial infrastructure investments.
Note: Numbers may not add due to rounding.
Source: Ontario Treasury Board Secretariat.
Building Together Through Federal–Provincial Partnerships
Flexible, adequate, fair and sustainable federal–provincial transfers are critical to ensuring sustainable public services. Ontario’s partnership with the federal government has resulted in important progress, including on key projects to unleash Ontario’s economy by harnessing its advantages in critical minerals and nuclear energy. However, more work remains to be done. Ontario is ready and willing to work with the federal government on shared priorities, including working together with all three levels of government to lower municipal development charges and support housing affordability, as well as funding infrastructure and transportation that strengthens the province’s economy and communities.
Ontario supports a Team Canada approach to stand up to U.S. tariffs and economic uncertainty by creating new opportunities for job creation and investment attraction, enhancing economic integration across Canada and diversifying into new markets. Provinces, territories and the federal government can achieve these common goals through key actions like unlocking free trade barriers within Canada, supporting strategic sectors like auto and steel and prioritizing domestic suppliers and materials when investing in national defence capacity.
To address long-term challenges in health care, education and other social services that Ontario continues to face, it is important for the federal government to ensure long-term, predictable funding for initiatives that federal, provincial and territorial governments have worked on together to implement. Ontario, along with other provinces and territories, continues to call on the federal government to make permanent the temporary 5 per cent minimum growth rate guarantee in the Canada Health Transfer, and increase and sustain support for the Canada-wide Early Learning and Child Care Agreement in order to achieve federal goals and targets.
Chart Descriptions
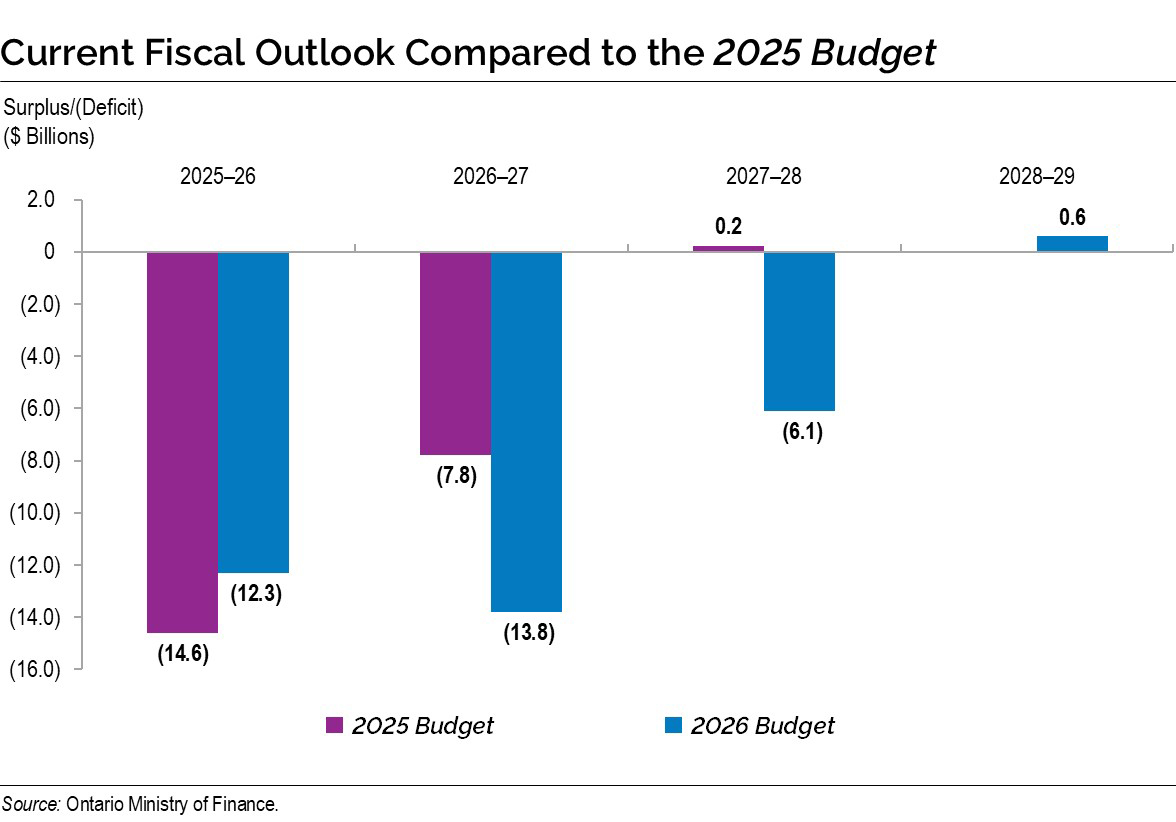
Chart: Current Fiscal Outlook Compared to the 2025 Budget
The bar chart illustrates the fiscal outlook presented in the 2025 Budget compared to the current outlook in the 2026 Budget. The 2025 Budget projected deficits of $14.6 billion in 2025–26, $7.8 billion in 2026–27, and a surplus of $0.2 billion in 2027–28. With the release of the 2026 Budget, the projections have been revised to deficits of $12.3 billion in 2025–26, $13.8 billion in 2026–27 and $6.1 billion in 2027–28, followed by a surplus of $0.6 billion in 2028–29.
Source: Ontario Ministry of Finance.
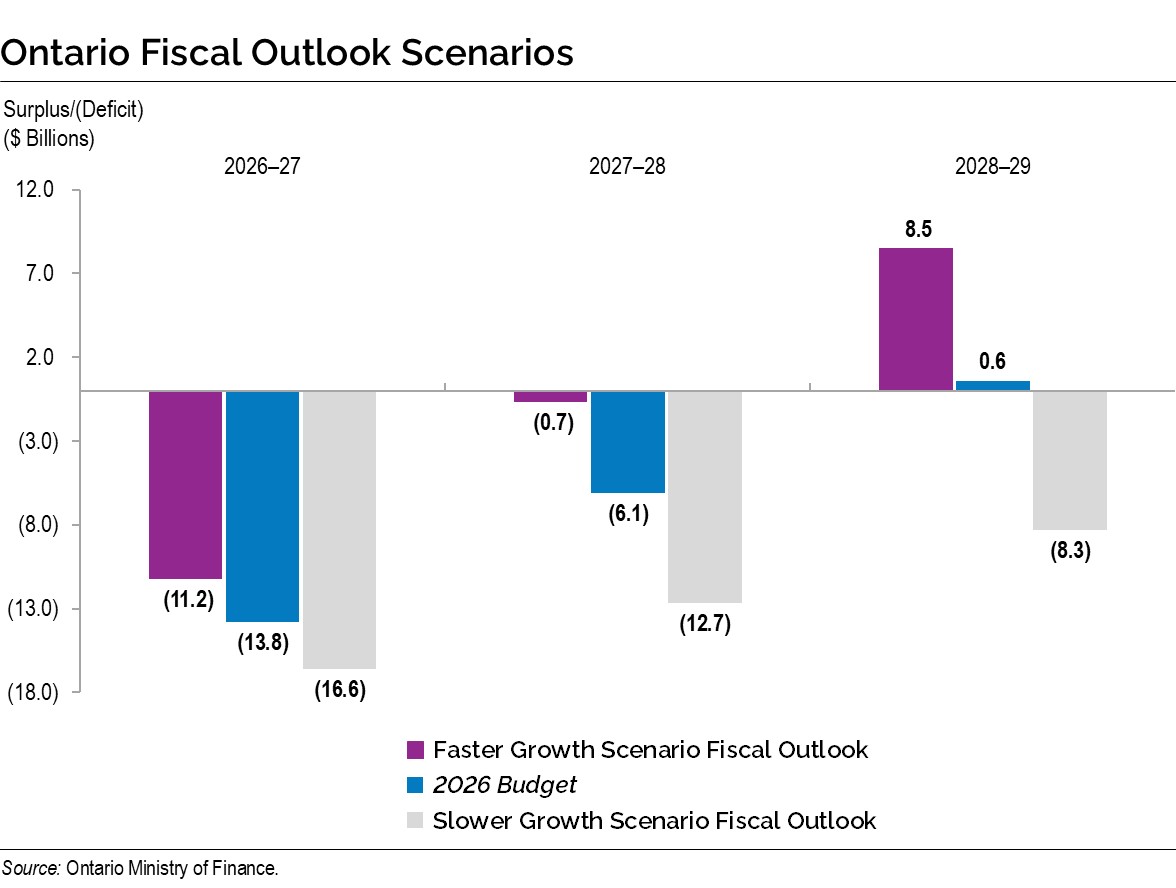
Chart: Ontario Fiscal Outlook Scenarios
The bar chart illustrates the range of Ontario fiscal outlooks based on the two alternative economic scenarios presented in Chapter 2: Economic Performance and Outlook. The 2026 Budget outlook estimates the deficit to be $13.8 billion in 2026–27 and $6.1 billion in 2027–28, followed by a surplus of $0.6 billion in 2028–29. Under the Faster Growth scenario, the deficit outlook is estimated to be $11.2 billion in 2026–27, $0.7 billion in 2027–28 and a surplus of $8.5 billion in 2028–29. Under the Slower Growth scenario, the deficit outlook is estimated to be $16.6 billion in 2026–27, $12.7 billion in 2027–28 and $8.3 billion in 2028–29.
Source: Ontario Ministry of Finance.